2023 Week 23 | Power BI: Build with Core Visuals
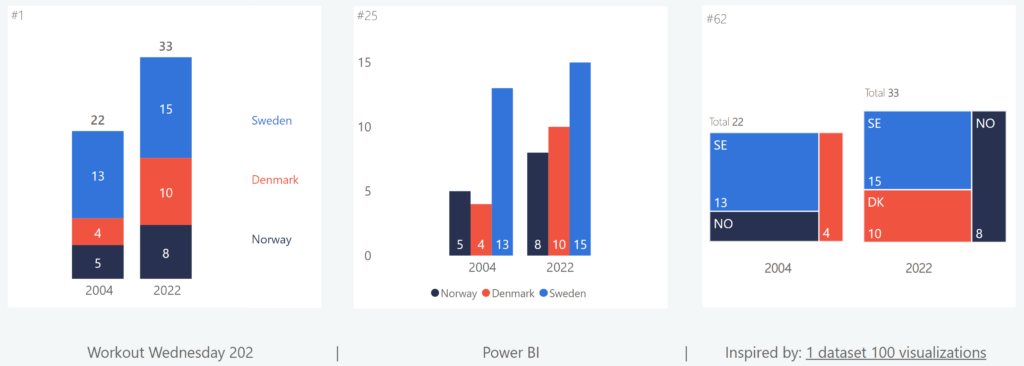
Introduction Welcome back to Workout Wednesday! This week’s inspiration comes from the incredibly cool 1 dataset 100 visualizations project, presented by the Data Viz Project. The basic premise of the 1 dataset 100 visualizations project is that the team created 100 visualizations using a single, simple dataset. In today’s exercise, we challenge you to re-create as many of […]
2023 Week 23 | Power BI: Build with Core Visuals Read More »
Power BI, Workout Wednesday