Sigma

2024 Week 45 | Sigma: Can you create these patient demographic visuals? 

Introduction Hey everyone! This week’s Workout Wednesday focuses on creating clear, actionable patient demographic visuals using a Sankey, a KPI, and two bar charts—binned and unbinned. Here’s the setup: the Sankey chart helps us map distribution, while the KPI delivers an at-a-glance view of a key metric to ground the analysis. With the bar charts, …

2024 Week 45 | Sigma: Can you create these patient demographic visuals?  Read More

2024 Week 44 | Sigma: How likely is a holiday birthday?

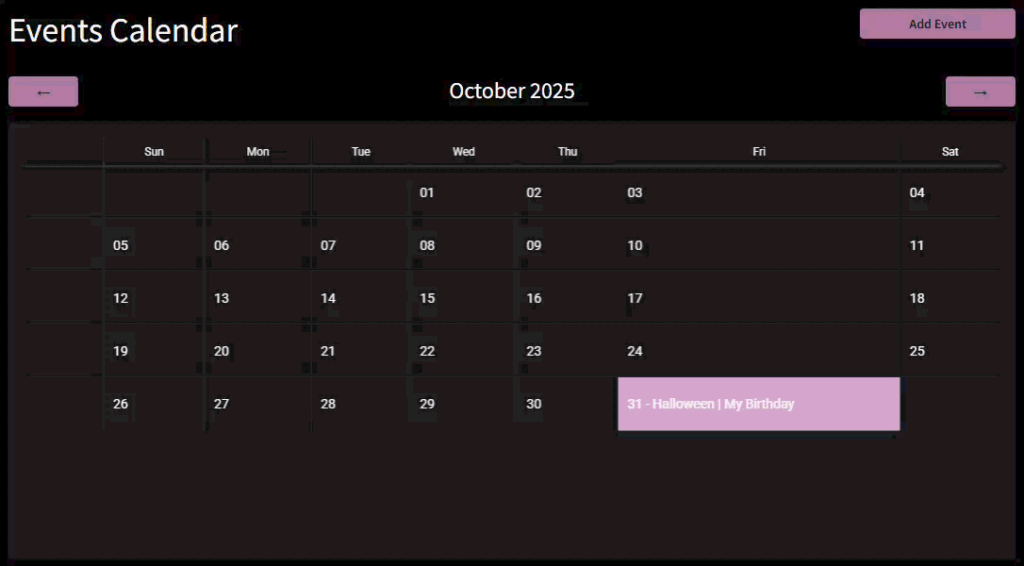
Introduction Welcome to Week Forty-Four! This week, I wanted to have a little fun because not only is Thursday Halloween, but it’s also my birthday.  As someone who loves data and shares her birthday with a holiday, I am interested to see just how common holiday birthdays are. In this challenge, you will use a couple …

2024 Week 44 | Sigma: How likely is a holiday birthday? Read More

2024 Week 43 | Sigma: Can you create a segmented date control?

Introduction This week, I wanted to highlight Sigma’s actions once again, as we got a new update a last week: The ability to change date controls via actions! Pairing this new feature with the ‘Conditions’ beta feature in actions, we can create more user-friendly date filtering with much less hassle. Stay up to date on changes to …

2024 Week 43 | Sigma: Can you create a segmented date control? Read More

2024 Week 41 | Sigma: Can you create a dynamic column bar chart? 

Introduction For this week’s challenge, we’re creating a dynamic column bar chart. The end user can select the number of columns to split the data into. Note that there are only 37 States in the Plugs data, so do your best not to hard code anything for a more realistic use case! Have fun!-Katrina Need …

2024 Week 41 | Sigma: Can you create a dynamic column bar chart?  Read More

2024 Week 40 | Sigma: Can you avoid the food?

Introduction Welcome to Week Forty! In my last article,  Week 36, we covered how to affect multiple columns using the same filter.  This week, we’re going to focus on even more advanced filtering techniques.  What do you do when you want to compare multiple arrays?  Luckily Sigma recently released a brand new function:  ArrayIntersection.   In …

2024 Week 40 | Sigma: Can you avoid the food? Read More

2024 Week 39 | Sigma: Can you test out changes in cost?

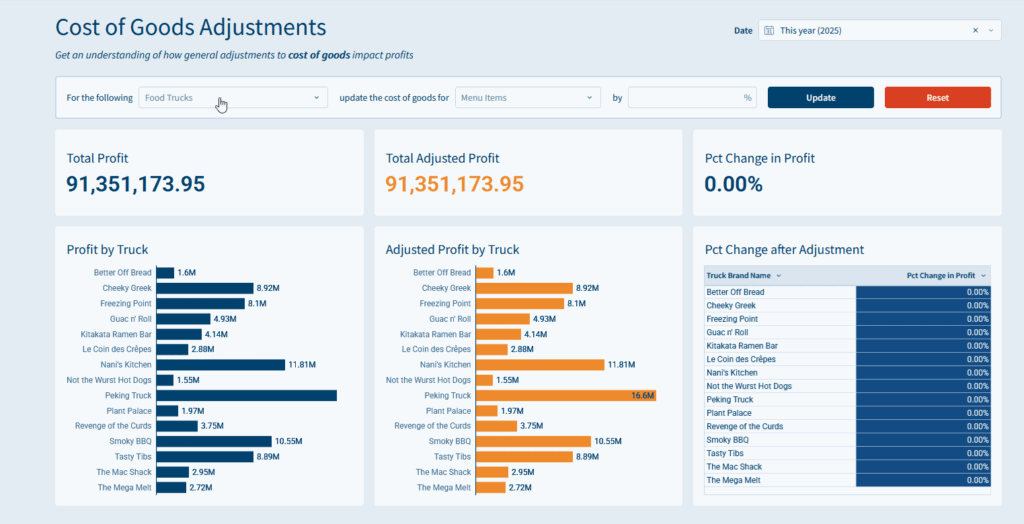
Introduction This week, I wanted to challenge myself to do something I didn’t know how to do in Sigma, I wanted to start laying the groundwork to do sensitivity analysis. I’ve often thought this would be possible in Sigma, since we can connect to Snowflake User-Defined Functions (UDFs) via Sigma’s function bar to call models …

2024 Week 39 | Sigma: Can you test out changes in cost? Read More

2024 Week 38 | Sigma: Can you create reference marks?

Introduction Welcome to Week 38! Sometimes there are events or notable data points that aren’t stored in your data, but you want to see how they effect the trends. Enter reference marks and conditional formatting! This week we practice using reference marks and conditional formatting to highlight specific dates and events. The formatting styles and …

2024 Week 38 | Sigma: Can you create reference marks? Read More

2024 Week 37 | Sigma: What would you like help with?

Introduction This week’s challenge is a bit different; you have two options!  Imagine you’re creating a workbook showing off all the cool features and functionalities to your coworkers and want to provide a curated list of Sigma’s help documentation. In this challenge, you’ll create an embedded documentation element enabling the end users to choose a …

2024 Week 37 | Sigma: What would you like help with? Read More

Scroll to Top