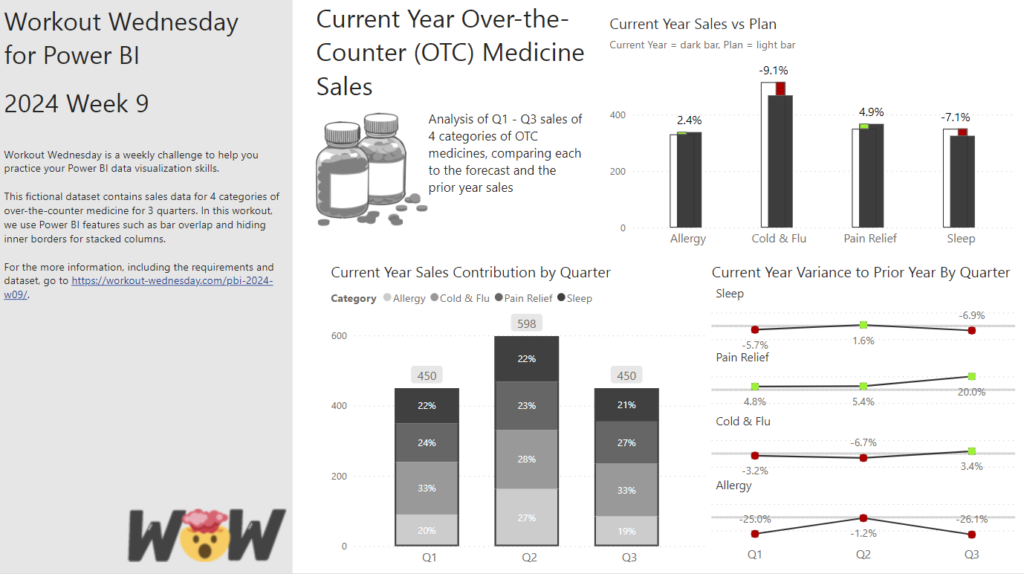
2024 Week 9 | Power BI: Use Bar Overlap and Border Formatting
Introduction Welcome to this week’s Workout Wednesday. This week, we are taking advantage of some new features in the February 2024 release of Power BI Desktop. We can now have bars overlap in a clustered column chart and hide the inner borders in a stacked column chart. This week, we’ll use those formatting options to […]
2024 Week 9 | Power BI: Use Bar Overlap and Border Formatting Read More »