Introduction
We are already into the mid 2024 and hope you are ready for another challenge! This is hopefully easier than some of the previous challenges we have set in CRM Analytics this year! It contains windowing function with input widgets. Yes, you read that right! Two great tools that can make your and your users life easier.
Requirements
- Create a dev org or use an existing org you have access to
- The dataset is the Energy dataset we used in some of the other challenges and is linked below
- Create a dashboard
- Calculate
- the average gas or coal or any other consumption of your choice.
- the % change in the consumption year over year.
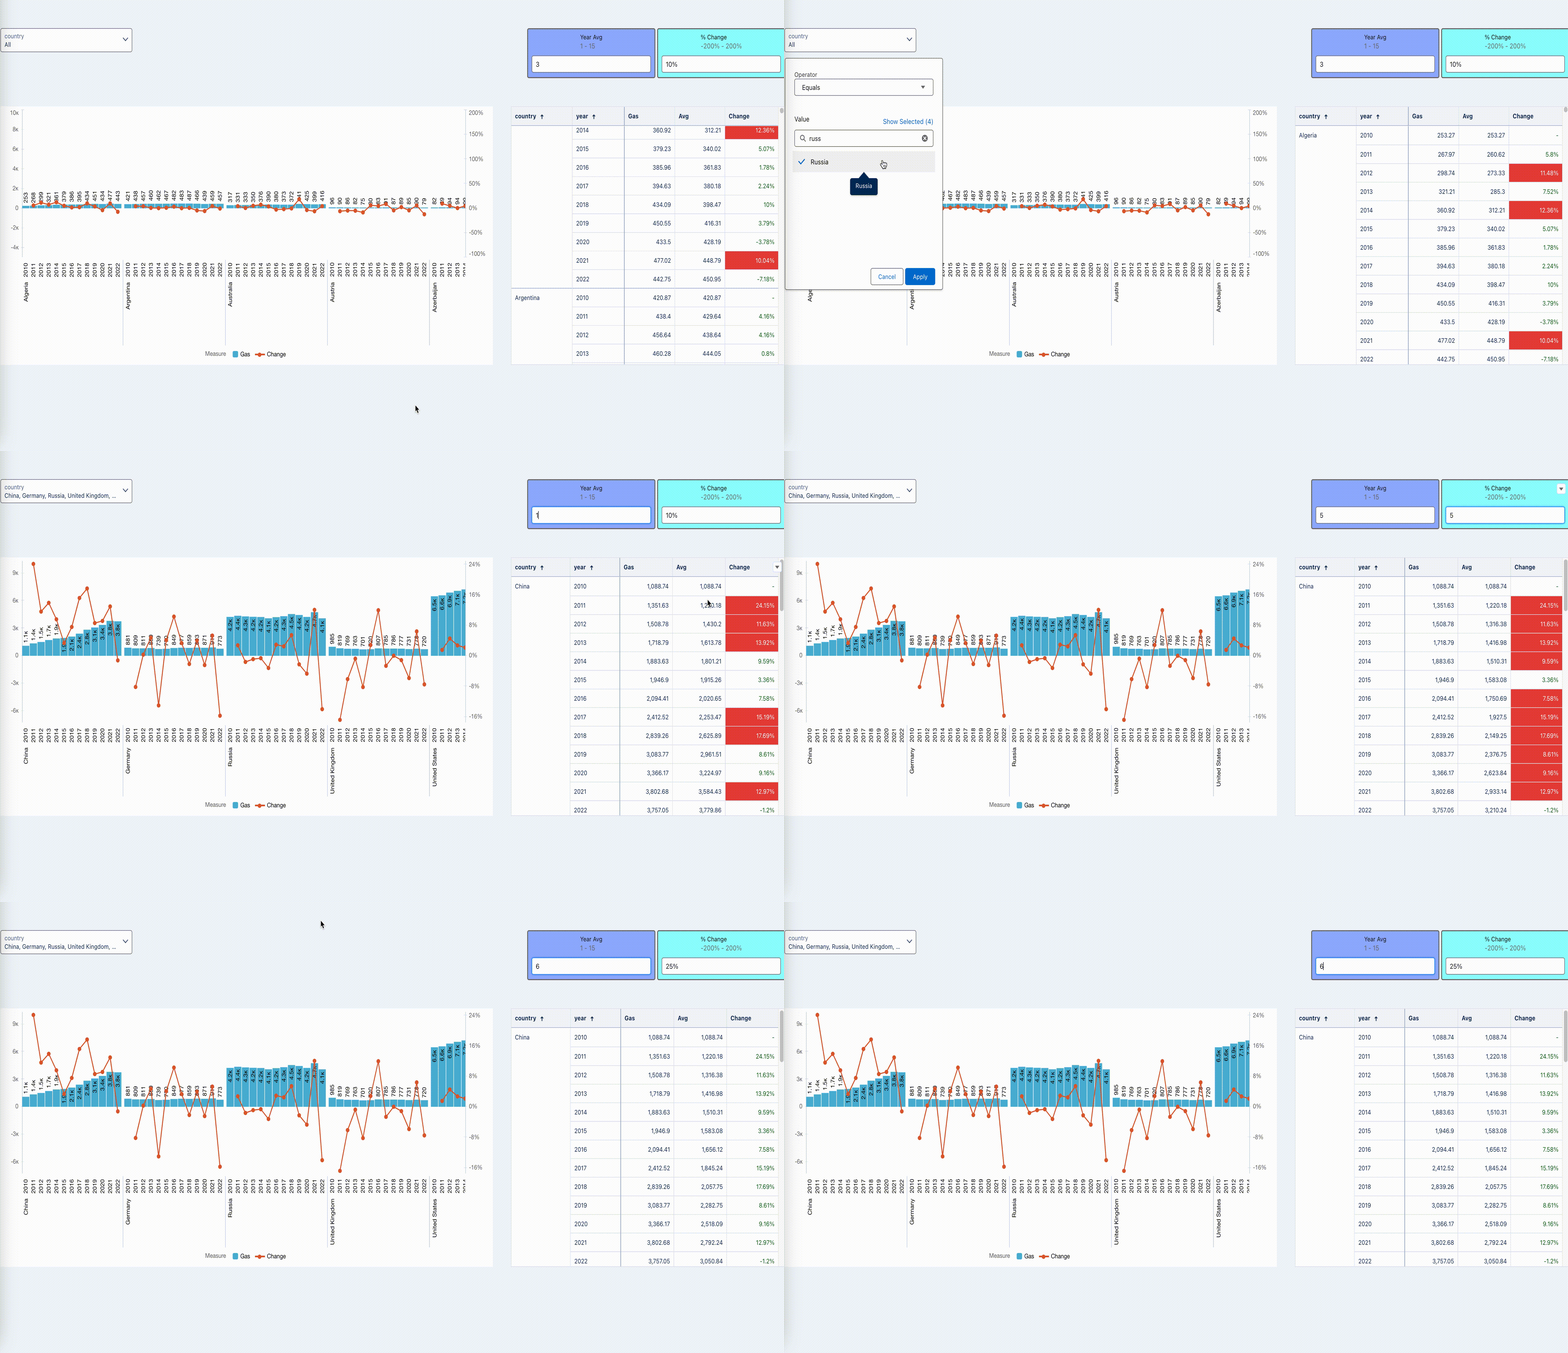
- Add one chart that shows the actual consumption with the % change.
- Add a table that changes the color of the % table based on the input widget.
- The same table also changes the average calculation (1 year average vs 3 vs 6 etc.) based on a second input widget.
The resulting dashboard should look something like this:

SAQL is not required! All is possible with Compact Form.
Dataset
This challenge uses a Energy dataset from “Our World in Data“. The curated data for the challenge is available here.
Share
After you finish your workout, share a screenshot of your solutions or interesting insights.
Either on Twitter using the hashtags #WOW2024 and #CRMA and tag @genetis, @LaGMills @msayantani, and @simplysfdc. (Or you can use this handy link to do that)
Or on LinkedIn, tagging Alex Waleczek, Lauren Mills, Sayantani Mitra, Phillip Schrijnemaekers and Johan Yu using the hashtags #WOW2024
Also make sure to fill out the Submission Tracker to track your progress and help us judge the difficulty of our challenges.