Introduction
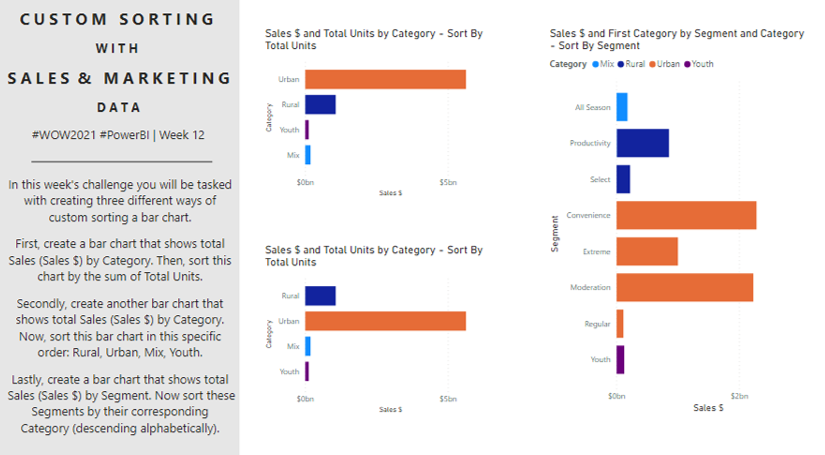
Thanks to everyone who has ben participating in #WorkoutWednesday – Power BI edition. This week we are going to be diving into a couple of different ways to custom sort your data. End users will often ask for specific sorting order, so figuring out how to do this in Power BI can be extremely helpful. See the example report below:

*the bottom left bar chart title says Sort by Total Units – this should be Forced Sort (as shown in the requirements below to Rural Urban, Mix, Youth).
Requirements
- Connect to the Sales & Marketing sample data set available on PowerBI.com
- Create two bar charts showing Sales $ by Category
- Sort the first bar chart by the Total Units field in descending order
- Sort the second bar chart by a custom field that force ranks the Categories into the following order – Rural, Urban, Mix, Youth
- Create a bar chart showing Sales $ by Segment
- Sort this bar chart by Category descending alphabetically
Dataset
This week we use the Sales & Marketing sample data set provided to us by Power BI. ou can connect to this data by navigating to your workspace on PowerBI.com. Then go to the bottom where is says Get Data with an ascending arrow. In this screen scroll down and click on the Samples link. Scroll down until you see the Sales and Marketing Sample option in green. Select Connect. Now open Power BI desktop and in the Home ribbon select the Power BI datasets option. In the list that pops up you should see the sample data set that was chosen. Click on this data set.
If this connection method is not available to you, you can click on this link to access the Sales & Marketing sample data set.
Share
After you finish your workout, share on Twitter using the hashtags #WOW2021 and #PowerBI, and tag @JSBaucke, @MMarie, @shan_gsd and @dataveld. Also make sure to fill out the Submission Tracker so that we can count you as a participant this week in order to track our participation throughout the year.
Hi
Does Microsoft offer something like tableau Public
Power BI is better than Tableau Public. It supports more connection types and you can keep your reports private
So Microsoft have watched your video of this challenge and improved the functionality of Sort and added Sort by legend. But nice to see how it used to be done.
Hi, I tried the same way to sort the Category in the prescribed order but instead of using a Measure, I used a calculcated column using Switch:-
Category Rank = SWITCH(‘Product'[Category], “Rural”,1,”Urban”,2,”Mix”,3,”Youth”,4)
But when I am trying to sort the Category using Category Rank column, I am getting an error of circular dependency.
Please explain why is it so.
It’s great fun learning with these challenges. Thank you, team !!
I used the Switch function in Measure instead of “IF” and also worked correctly.