Introduction
In Power BI, you are able to create mobile views for every desktop report. This is especially useful if you have users access the reports through the Power BI app on an iOS or Android device.
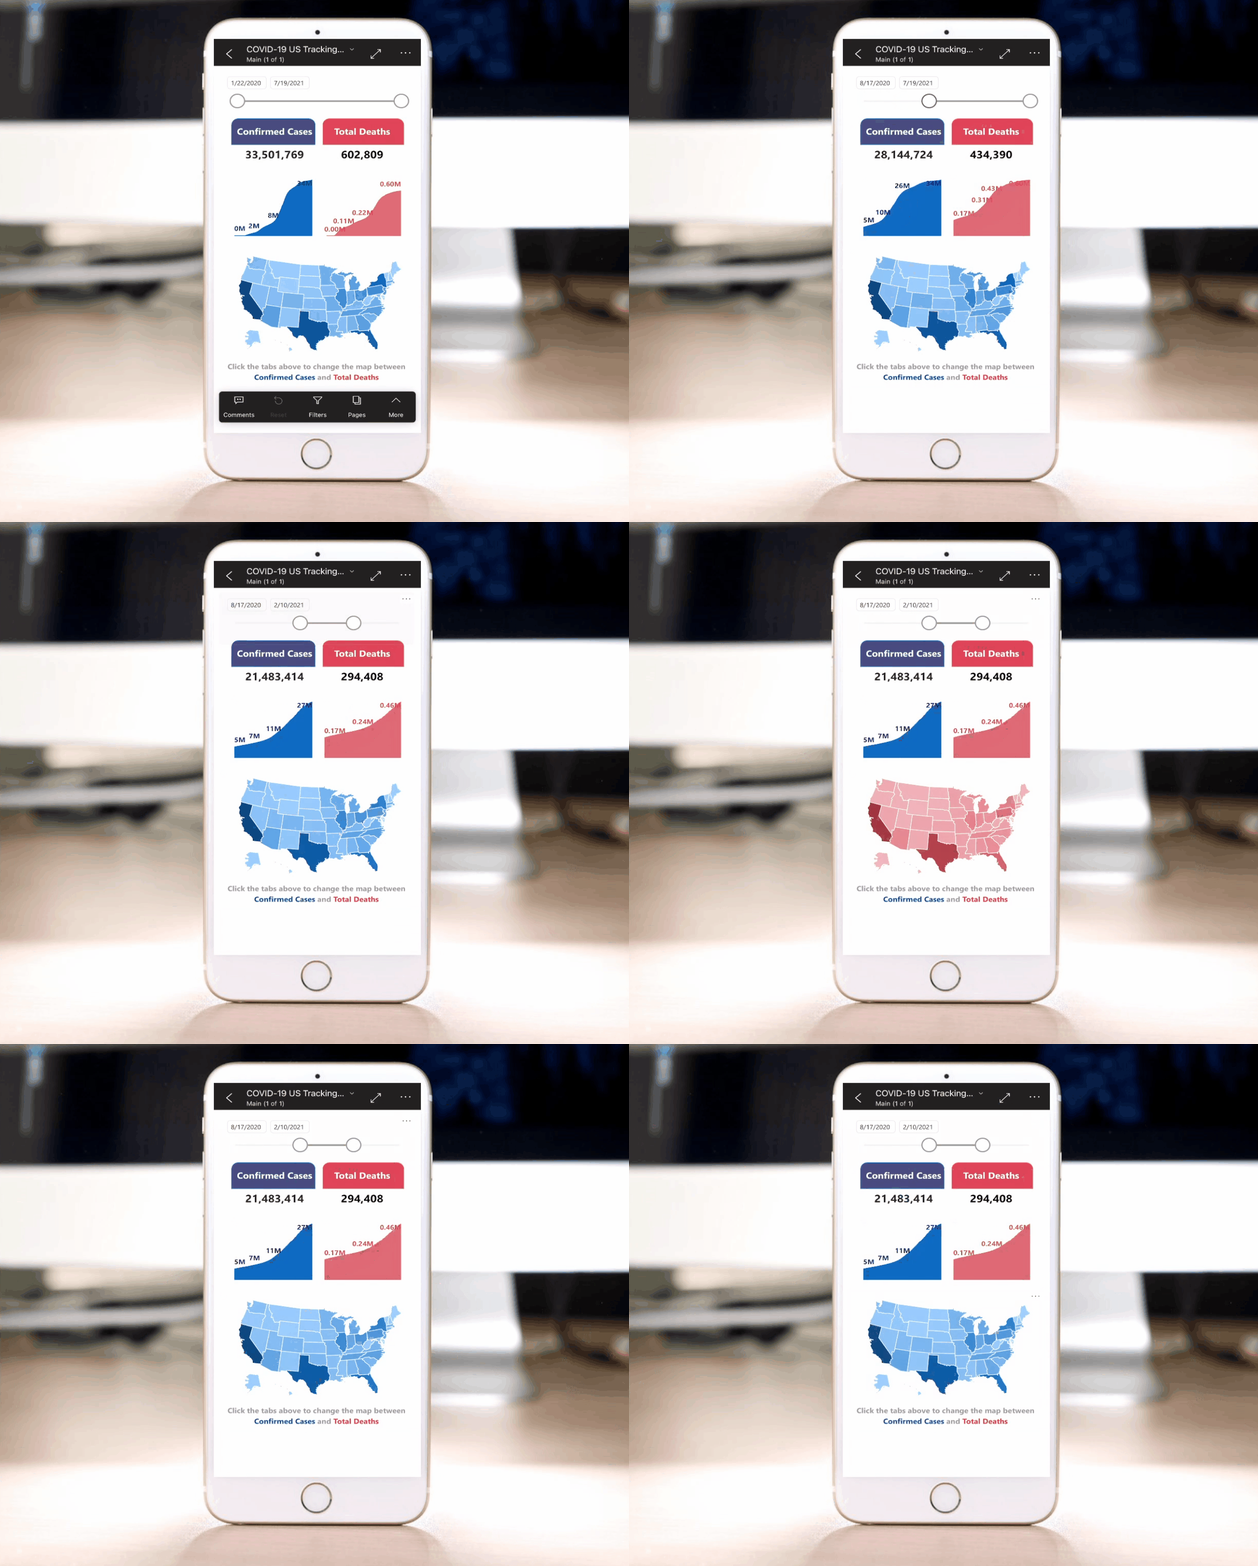
This week’s challenge is to develop a mobile view of the Covid-19 tracking sample for US state and local governments. The data source for this dashboard can be scheduled for refresh, but to keep this challenge more manageable, I am only requiring that we create a mobile view on the existing data shown in the downloadable .pbix file.

Requirements
Covid-19 Report Preparation
- Download the Covid-19 Power BI file here
- Change the font size of the total confirmed cases to fit within the view without text wrapping
- Familiarize yourself with the dashboard actions by taking note of the two key states in the bookmarks view (HINT: You will use these in your mobile view)
- Blue Map – Bookmark to show map of confirmed cases
- Pink Map – Bookmark to show map of death
- Change the color of the map when showing confirmed cases to be a gradient of blue and the color of the map showing deaths as a gradient of red
- This provides a clearer visual representation of the metric used within the map and will reduce confusion
Build a Mobile View
- Navigate to the “Mobile View”
- Add the date slicer to the top of the view
- Insert two tabs similar to the style in the desktop view for showcasing total confirmed cases and deaths
- Create a new matrix visual to show only the total confirmed cases and deaths
- Develop a cumulative view of confirmed cases and deaths over time (no need to do a daily view unless you’d like to)
- Add the “blue map” and “pink map” from the desktop view
- Show Blue Map by default (Confirmed Cases)
- Switch between maps when the total deaths and total confirmed cases tabs are clicked
Download Power BI iOS / Android App (Optional)
- Download app
- Open the mobile view within the app
- Add a Siri Shortcut (iOS Only)
Dataset
Download the Covid-19 US Sample Report here
Share
After you finish your workout, share on Twitter using the hashtags #WOW2022 and #PowerBI, and tag @JSBaucke, @MMarie, @shan_gsd, @KerryKolosko, and @NerdyWithData. Also make sure to fill out the Submission Tracker so that we can count you as a participant this week in order to track our participation throughout the year.