Introduction
What do you want to highlight on hover? Practice with the Deneb Custom Visual.
This week’s challenge was created using the Deneb custom visual in Power BI. I was inspired by the many examples on the Vega-Lite website. The chart displays Sales and Profit grouped by country and segment, based on a sample Power BI dataset. It includes interactive features like hover effects and dynamic filtering.
Requirements
Get data
- Open Power BI desktop and use the Power BI sample data that contains Sales and Profit data
Create visuals
- Download – Power BI Custom Visual -Deneb
- Create Grouped Bar Chart/Scatter
- Hover Effects: Set different colors on hover.
- Tooltips: Displayed additional data on hover (Total Sales, Total Profit, Profit Margin).
- Filters: Added filters for Year (2013 and 2014) and/or Segment to dynamically adjust the chart.
Note: There are many opportunities to further enhance the chart, like adding trend lines or adjusting axis formatting. AI is good help to generate json files.
Dataset
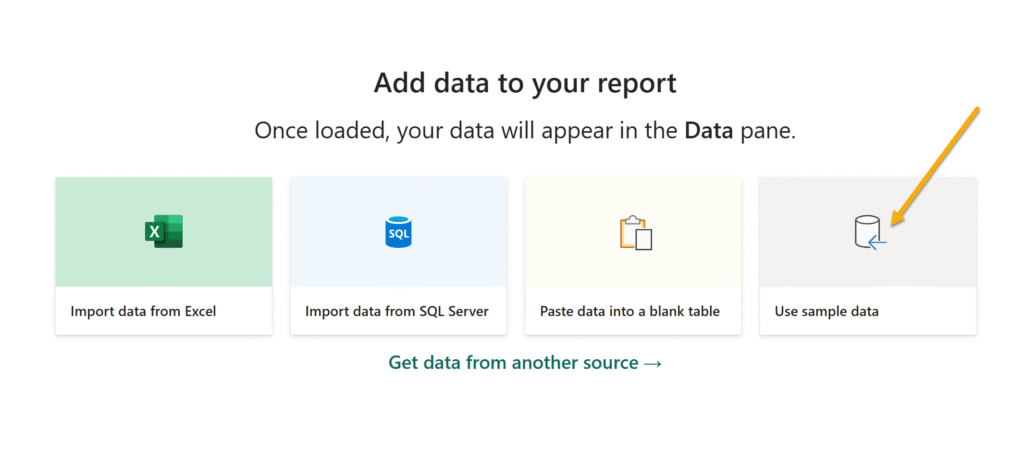
This week we’re using the sample dataset that you can find inside of Power BI desktop. Open a new Power BI desktop file and select ‘Use sample data’ from the splash screen on the canvas.
Share
After you finish your workout, share on social media using the hashtags #WOW2025 and #PowerBI. Tag me (Eszter) on LinkedIn, along with Meagan, Kerry, and Shannon. Also feel free to tag the Deneb creator himself, Daniel Marsh-Patrick!
On Bluesky, tag @mmarie.bsky.social, @shan-gsd.bsky.social, and @merrykerry.bsky.social.
Solution
Download the solution file to see exactly how the report is built!