Introduction
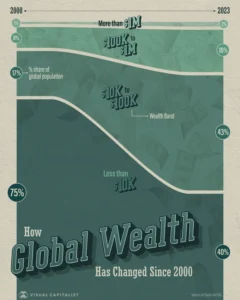
Recreating visuals you find online helps you build visual design skills and find workarounds to common problems or feature gaps in Power BI. This week, we are recreating this infographic from Visual Capitalist about the change in global wealth. The original is shown below, followed by my version in Power BI.

Requirements
Create a visual that shows the percent of the global population by wealth (net worth) band by year.
- Your visual must show all years available in the data.
- All four wealth bands must be labeled
- The percent values for the years 2000 and 2023 must be labeled. The other years should not be labeled.
- The beginning and ending years of the data must be labeled. The middle years should not be labeled.
- Design your visual so it looks like the wealth band segments are separated with a bit of space between them.
- Add a label next to one of the percent values to identify it as “% share of global population”.
- Add a label next to one of the wealth bands to identify it as “wealth band”.
- Place the title on top of the visual in the space below the line for the “Less than $10k” wealth band. For an extra optional challenge, make the title look similar to the title in the original infographic, including different font colors, textures, and orientations. Hint: I did this in Figma.
Dataset
You can retrieve the data for this challenge from the source web page: https://www.voronoiapp.com/wealth/How-Global-Wealth-Has-Changed-Since-2000-3120.
Share
After you finish your workout, share on social media using the hashtags #WOW2025 and #PowerBI. Tag us on LinkedIn: Meagan, Kerry, and Shannon.
On Bluesky, tag @mmarie.bsky.social, @shan-gsd.bsky.social, and @merrykerry.bsky.social.