Introduction

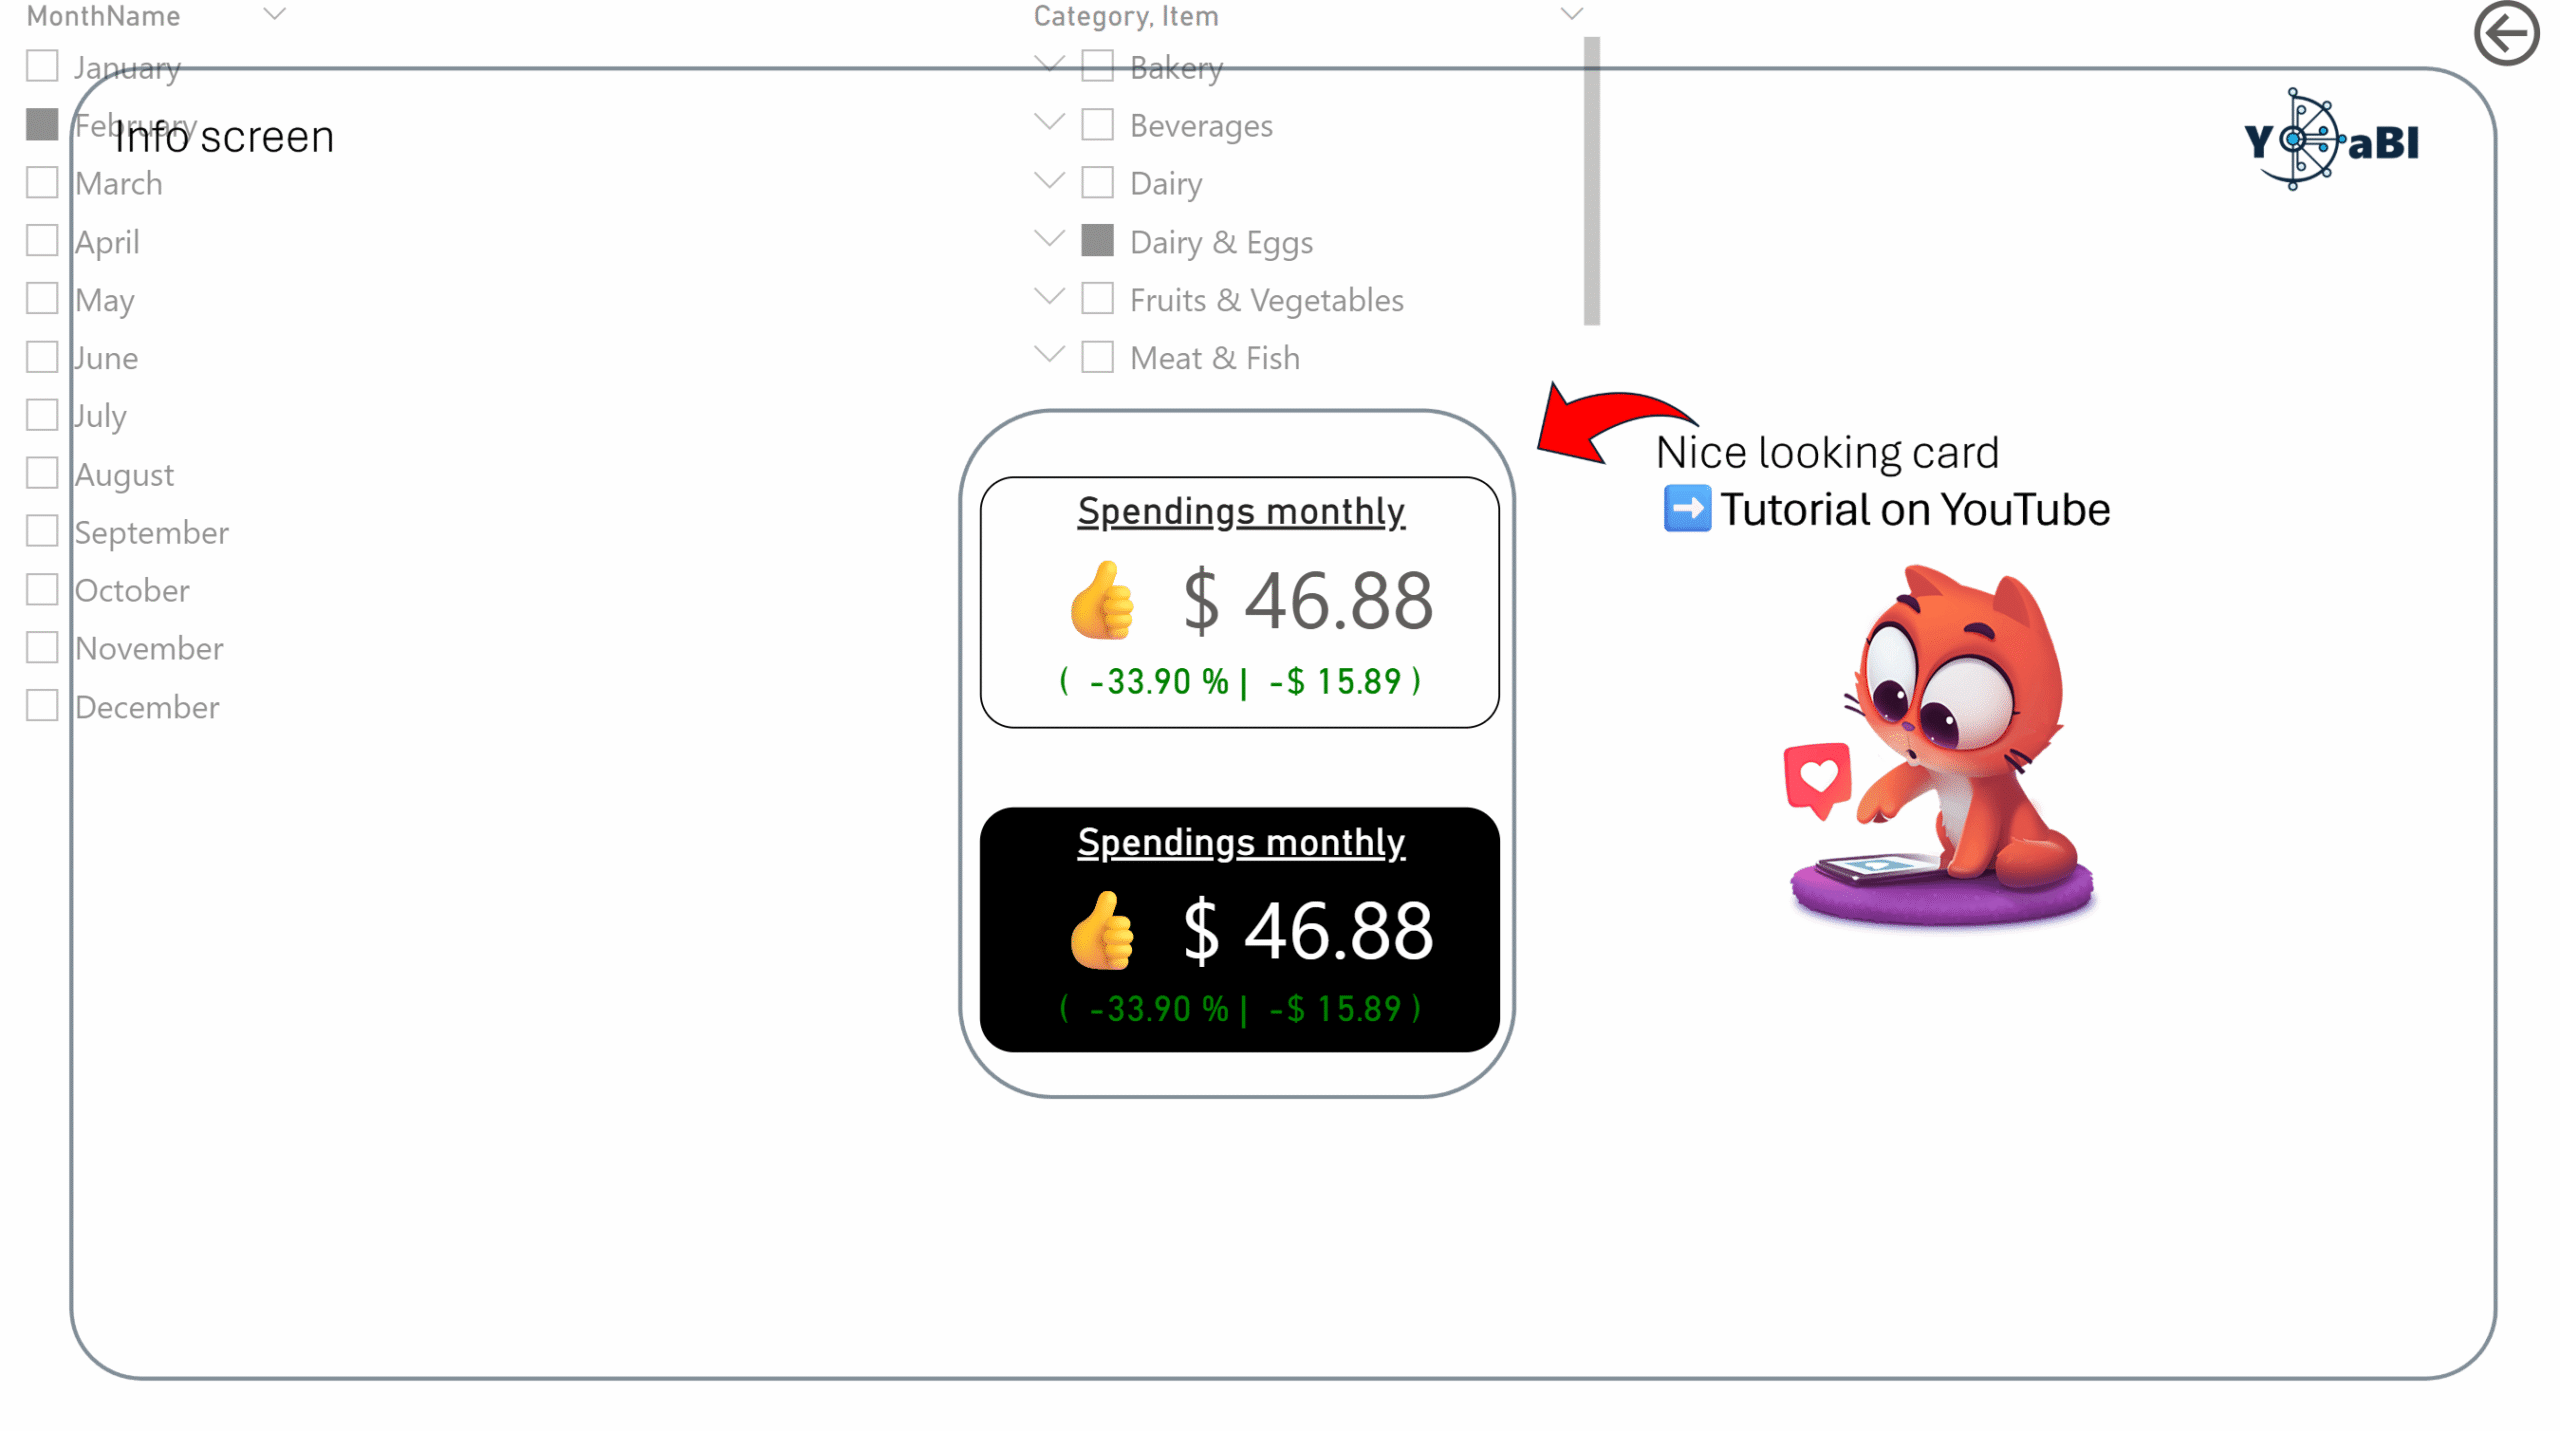
Week 42, we’re taking a step behind the visuals—because every great report deserves a great Info Page!
Your report might tell the what, but your info page explains the why—and that’s where real understanding begins.
No fancy tools, no measures — just thoughtful design and storytelling.
Your challenge: Build an Info Page that guides your users like a mini manual inside your report!


Whether it’s your first-time viewer or your CEO, everyone will know exactly how to read and use your report.
Ready to turn confusion into clarity?
Let’s build Power BI reports that speak for themselves!
Ready? Set? INFO it up!

Requirements
- Finished Report in Power BI Desktop + some Bookmarks
- Power Point to create a Info page
- Style guide for CI conformity (optional)
Dataset
Data for this challenge can be downloaded. There are 3 tables needed for this exercise: Date, FactSales, and DimSalesTerritory.(We reuse the Dataset from week 16)
You can also use your own data sets—this time it’s not about the data, but about user-friendliness.
Share
After you finish your workout, share on social media using the hashtags #WOW2025 and #PowerBI. You’re welcome to tag the author(s) on LinkedIn! [Kathrin Borchert]
On Bluesky, tag @mirrortears.bsky.social, @mmarie.bsky.social, @shan-gsd.bsky.social, and @merrykerry.bsky.social.
Solution
No solution file this time! Just a video on how to create info pages and why you should use them!


