Introduction
Welcome to Week 43 of 2025!
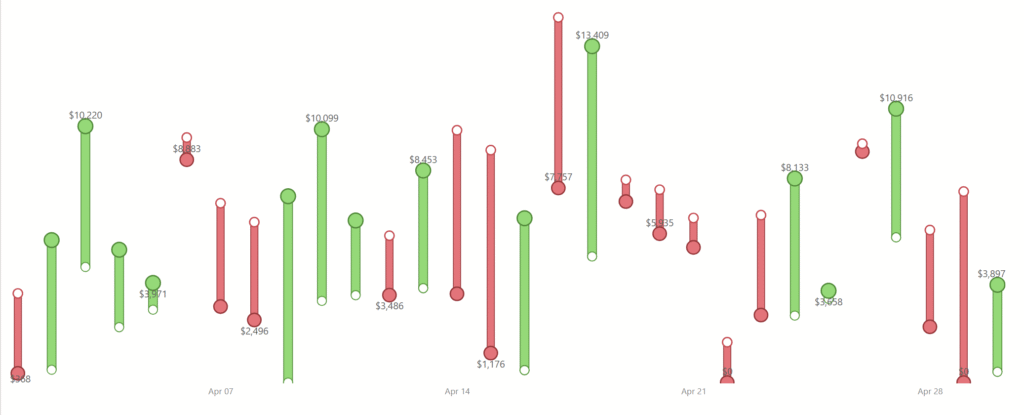
This visual was built to make change visible. The goal was not just to show numbers, but to tell a quick, visual story of how performance moves from one point to another.
Each line represents a small comparison between two dates or periods. When the line is green, the value increased. When it is red, it decreased. The height of the line shows how big the difference is, and the dots mark where each period starts and ends. This lets anyone instantly see what’s going up and what’s going down, without reading a table or thinking through raw data.
The approach focuses on the rhythm of performance. It turns a dense collection of daily results into a kind of visual heartbeat. Days of growth appear as pulses of green, while days of decline show up in red.
The visualization uses Power BI’s built-in features in a slightly unconventional way. Instead of using error bars for uncertainty or range, they are used as connectors between two points. This trick creates clean vertical bars that link past and current values. Combined with color and shape, it transforms a plain metric comparison into something much more expressive.
The same idea can be used for many metrics: sales, revenue, conversions, or anything that naturally changes over time. It’s not about showing totals, but about showing movement. Decision-makers don’t just need to know how big a number is, but how it’s behaving.
Requirements
To build this report, you’ll need the following pieces in place:
Dataset
A table with base measures for:
- Revenue
- Customers
Transactions
Share Your Work
Inspired by the Workout Wednesday approach, this dashboard supports easy storytelling and collaboration.
Share your version with hashtags like #WOW2025 and #PowerBI.
Dataset
Find this week’s dataset in Excel at: Workspaces / Workout Wednesday / 2025 / 2025W21 – Sales
Share
After you finish your workout, share on social media using the hashtags #WOW2025 and #PowerBI. Tag me (Andrei) on LinkedIn, along with Meagan, Kerry, and Shannon.
On Bluesky, tag @mmarie.bsky.social, @shan-gsd.bsky.social, and @merrykerry.bsky.social.