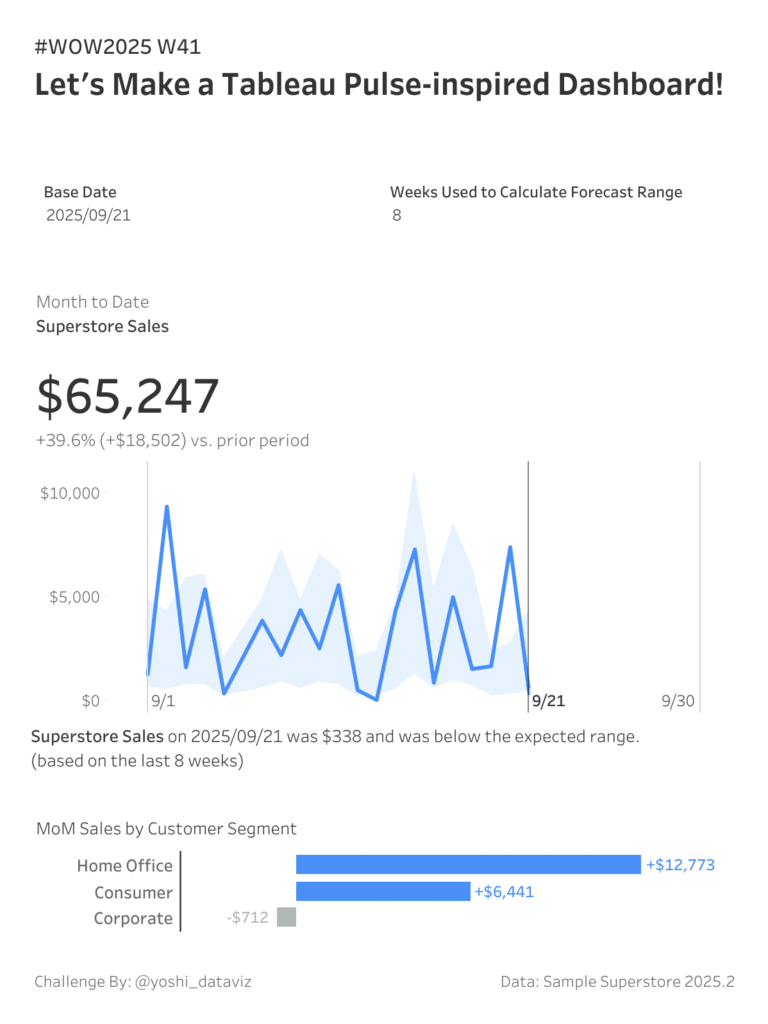
#WOW2025 | Week 41 | Let’s Make a Tableau Pulse-inspired Dashboard!
Introduction In this challenge, you’ll recreate a Tableau Pulse–inspired dashboard from scratch. One of the key features of Tableau Pulse is to automatically detect trends and changes in your data, displaying an “Expected Range” for each metric to help users instantly grasp performance at a glance. Your task is to reproduce this concept using Tableau’s […]
#WOW2025 | Week 41 | Let’s Make a Tableau Pulse-inspired Dashboard! Read More »
Tableau, Workout Wednesday