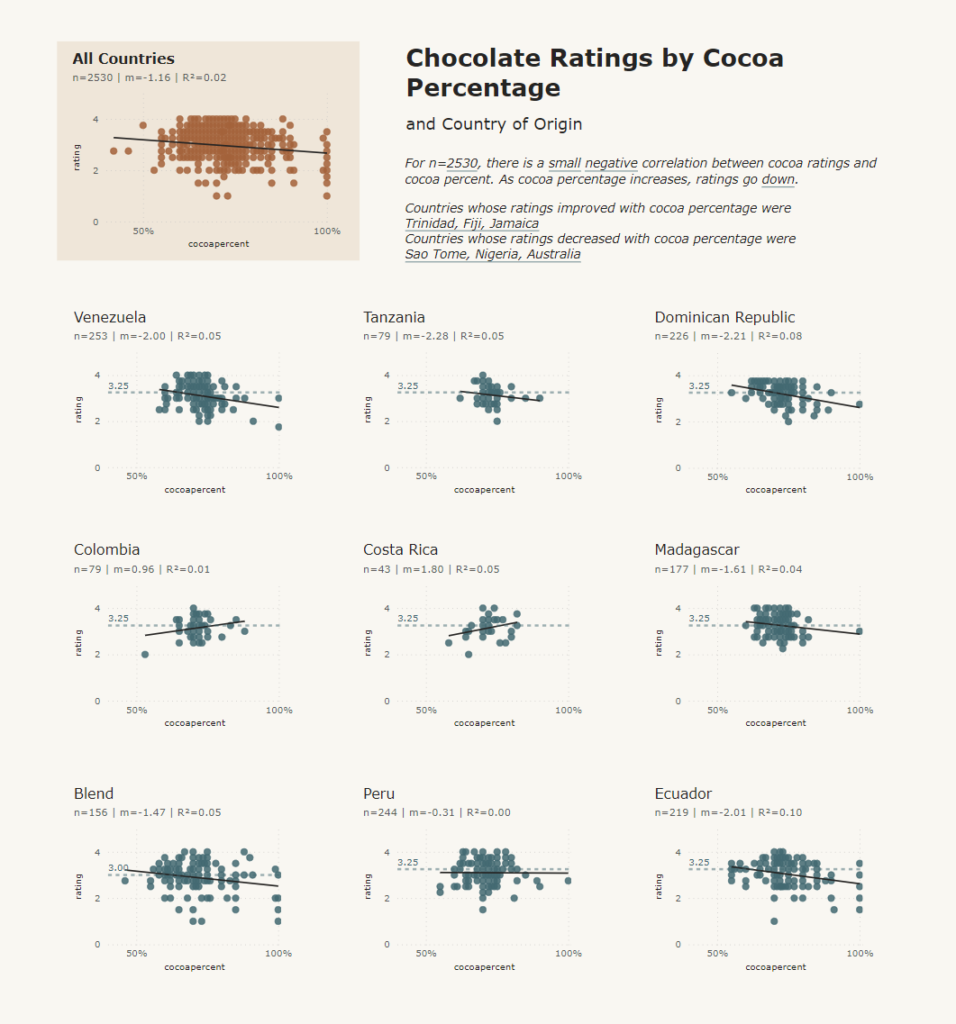
2023 Week 11 | Power BI: Determining trend with LINEST
Determining trend for use in smart narratives with DAX LINEST and Power BI
2023 Week 11 | Power BI: Determining trend with LINEST Read More »
Power BI, Workout WednesdayDetermining trend for use in smart narratives with DAX LINEST and Power BI
2023 Week 11 | Power BI: Determining trend with LINEST Read More »
Power BI, Workout Wednesday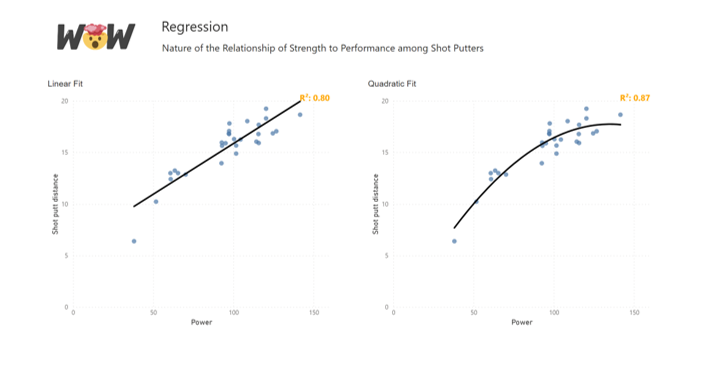
Introduction This week for Workout Wednesday we will be trying our hand at non-linear regression with the Deneb custom visual. With Vega and Vega-Lite we can create a non-linear line of best fit over our data points and utilise the statistical API to return a correlation coefficient. Requirements Power Query Obtain the dataset from the
2023 Week 07 | Power BI: Non-linear Regression Read More »
Power BI, Workout Wednesday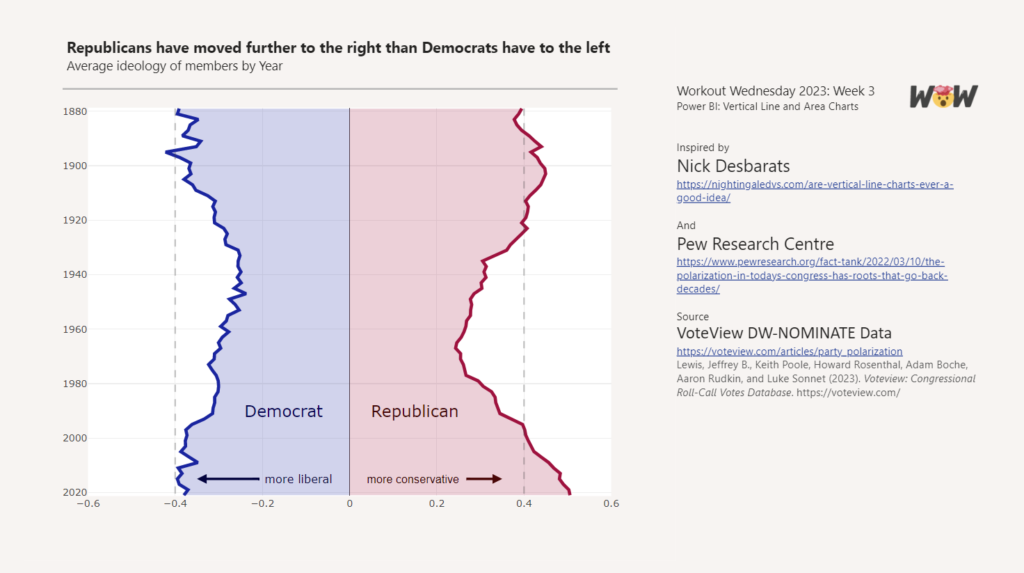
Introduction Howdy All! We’re all topsy-turvey this week turning line charts on their side! ⇩ This weeks challenge was inspired by Nick Desbarats article Are Vertical Line Charts Ever a Good Idea? Can you find some other examples where vertical line charts may be a good idea? ⋟^◕ܫ◕^⋞ Happy Vizzing Requirements Power Query Obtain the voteview_polarization_data.csv
2023 Week 03 | Power BI: Vertical Area Chart Read More »
Power BI, Workout Wednesday
Introduction “Hot days, warm nights, beaches, backyard cricket and Christmas celebrations are all part of summer in the Southern Hemisphere.” This week we will be connecting to a public flickr photo gallery from the State Library of South Australia, to create an image carousel using a custom visual from AppSource. Requirements Power Query Connect to the
2022 Week 52 | Power BI: Image Carousel Read More »
Power BI, Workout Wednesday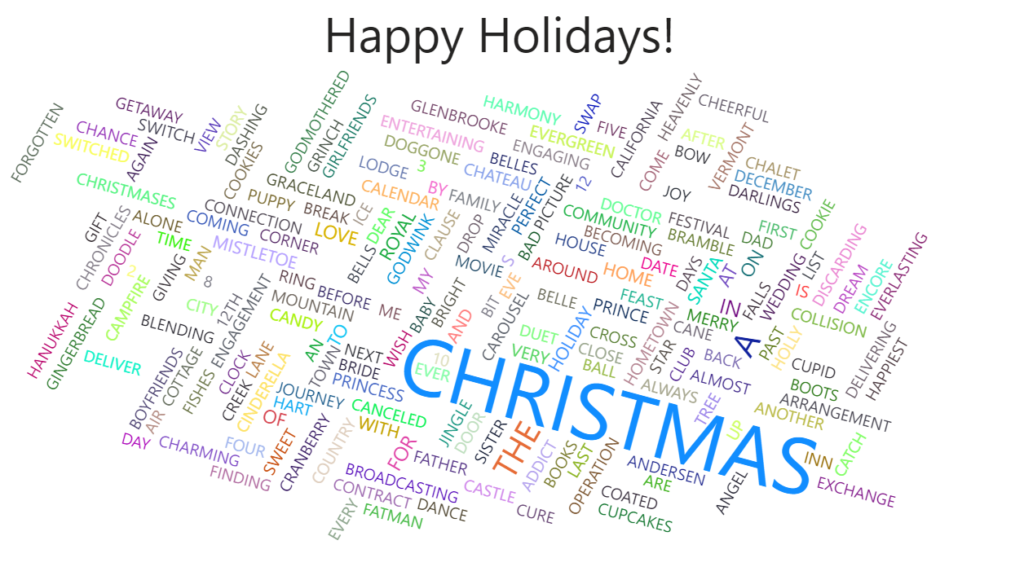
Introduction Me and my family love sitting down and watching Christmas movies during the holiday season! In this challenge we are going to be breaking down the words used in Christmas movie titles. Check out the word cloud that we are going to be creating below! Requirements Power Query In order to get this data
2022 Week 51 | Titles of Christmas Movies Read More »
Power BI, Workout Wednesday