sets

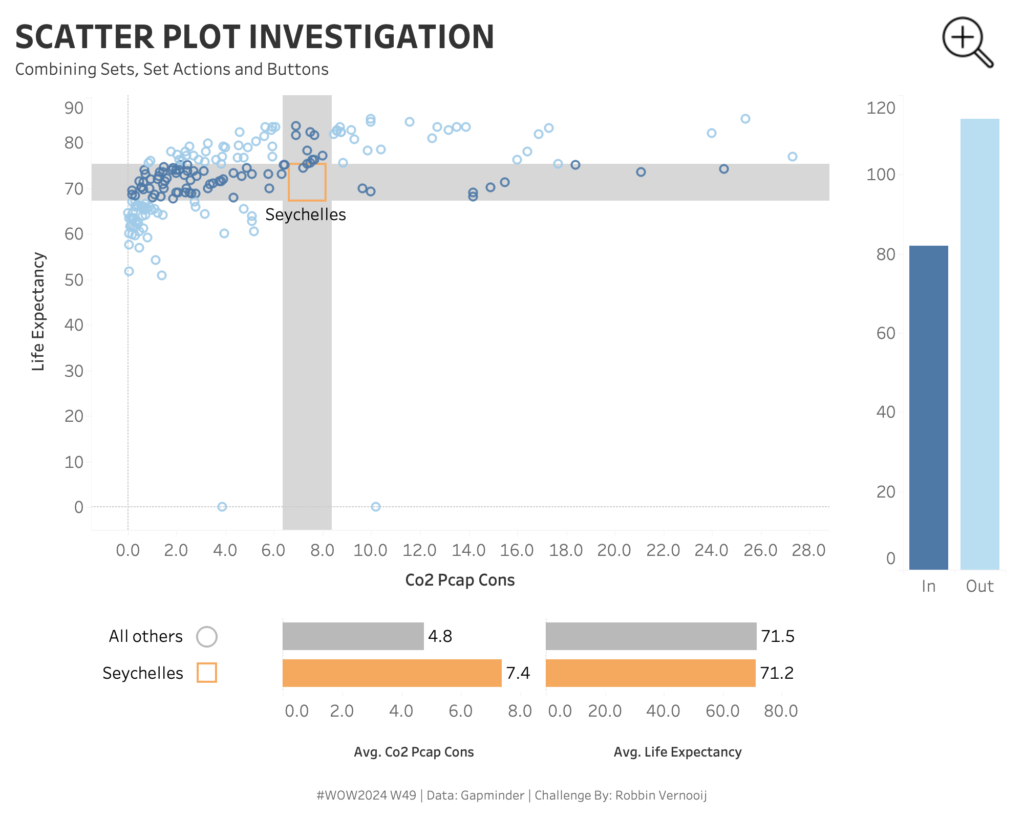
#WOW2024 W49: Can you create a scatter plot investigation?

Introduction This weeks challenges come from a fellow Data School Coach, Robbin Vernooij. He created this back in 2019, but I thought it was a pretty cool dashboard and gets you to think about Sets in a good way! Click to open in Tableau Public Requirements Dashboard Size 1000×800 Connect the data together You can …

#WOW2024 W49: Can you create a scatter plot investigation? Read More

A shot of a dashboard and bar charts

2023 Week 32: Can you show all values when filtering?

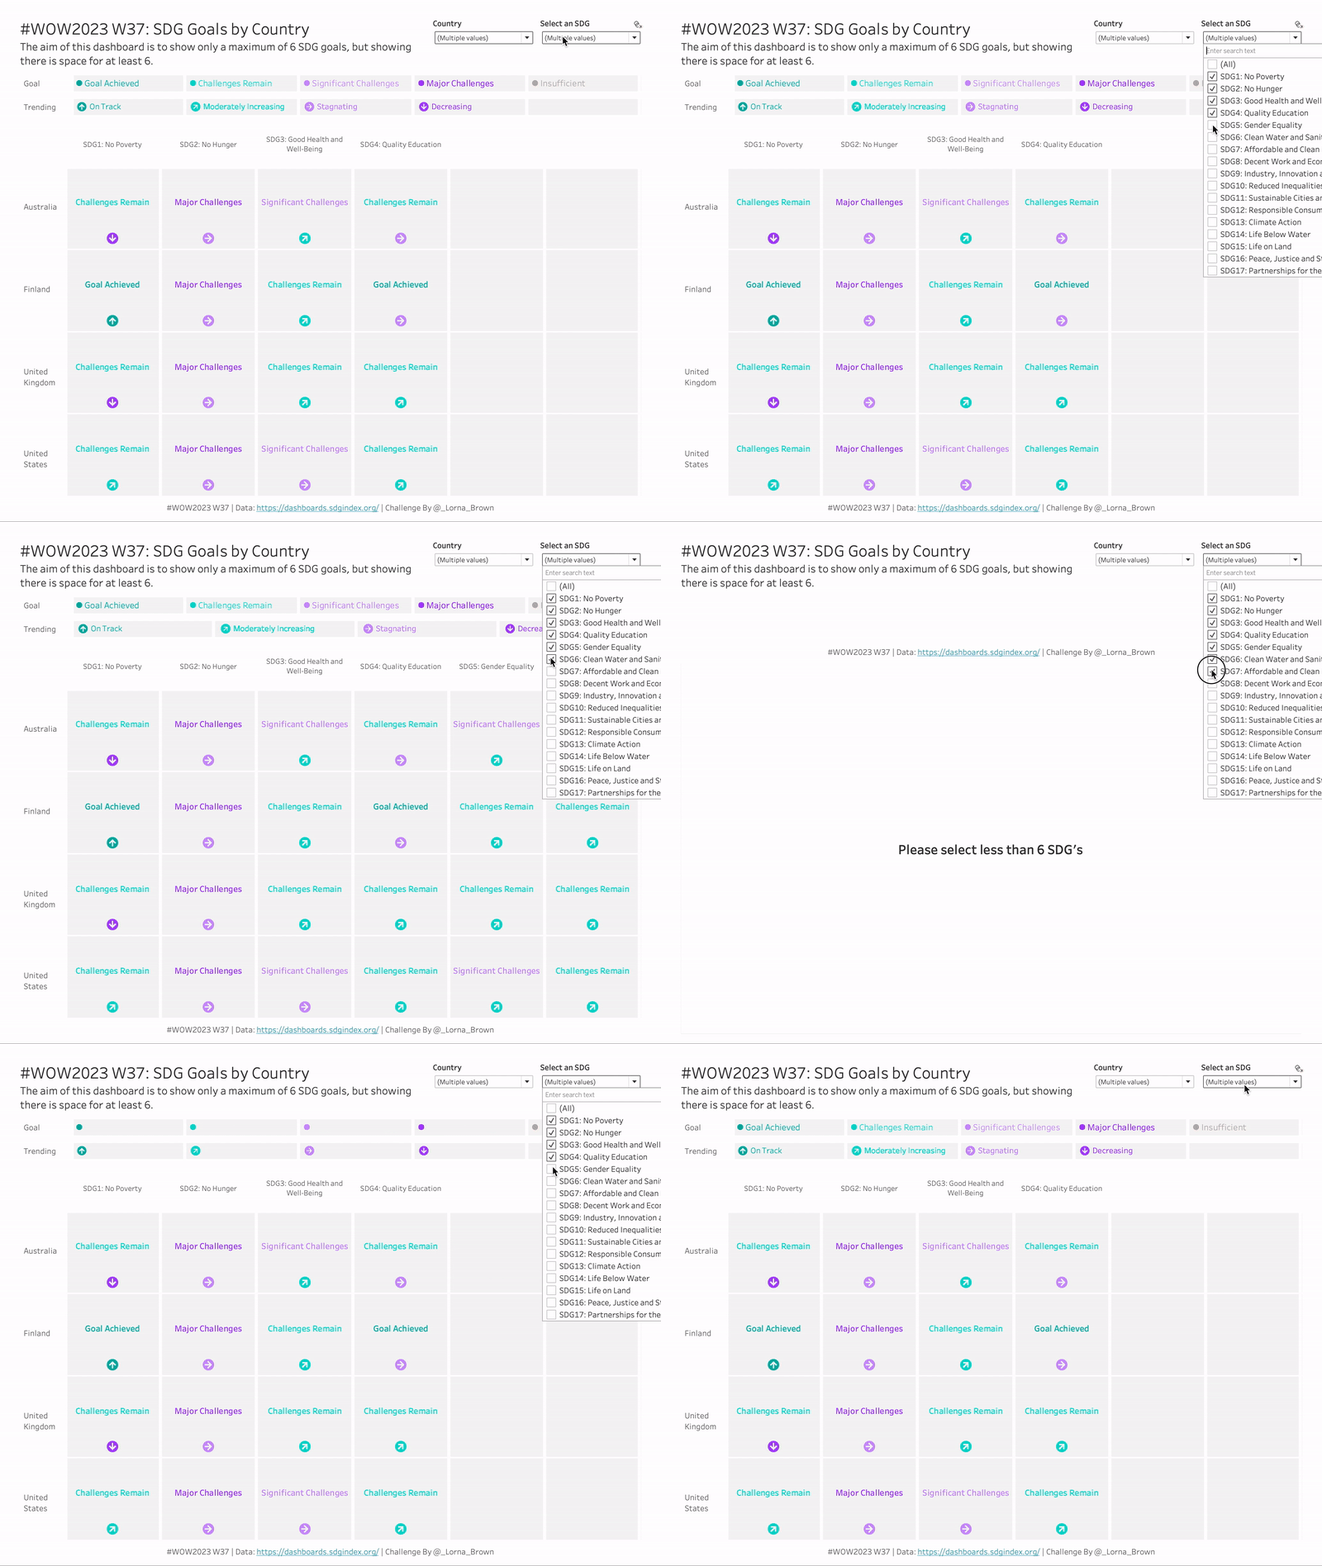
Introduction This week we have a special guest, Venkatesh Iyer. Venkatesh is currently a Senior Analytics Consultant at phData–and has recently written a number of blogs that bring novel solutions to the community, including: How to improve the performance of count distinct How to Create a Drill Down Table in Tableau How to paginate in …

2023 Week 32: Can you show all values when filtering? Read More

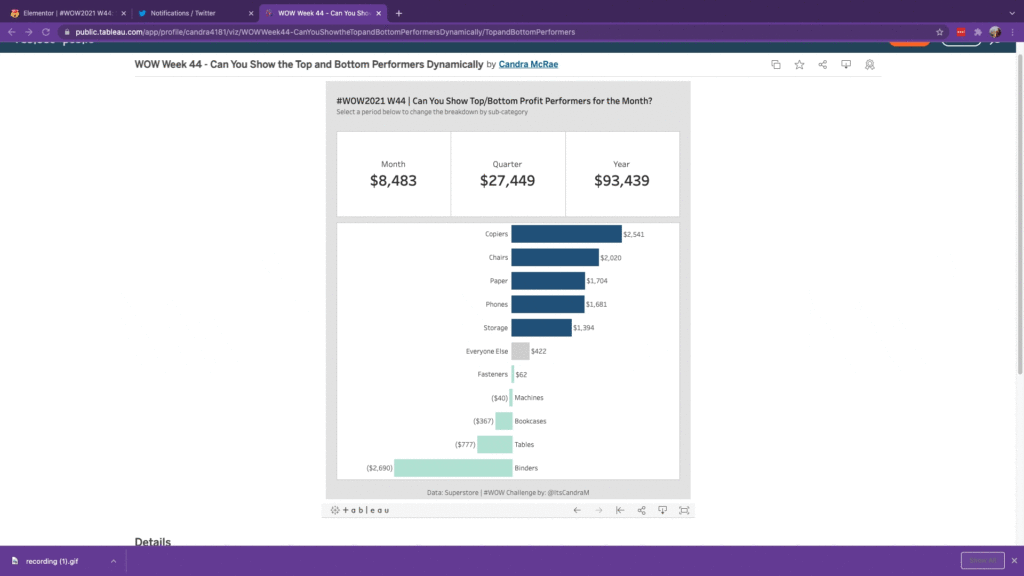
#WOW2021 W44: Can You Show the Top and Bottom Profit Performers for the Selected Time Period?

Introduction To round out my beginner #WOW2021 series and as a nod to the most wonderful time of the year (#TC…duh), I wanted to re-imagine a couple of blasts from the Tableau Conference past…so while no points for originality here, my hope is that the principles of these tricks of the trade will help reduce …

#WOW2021 W44: Can You Show the Top and Bottom Profit Performers for the Selected Time Period? Read More

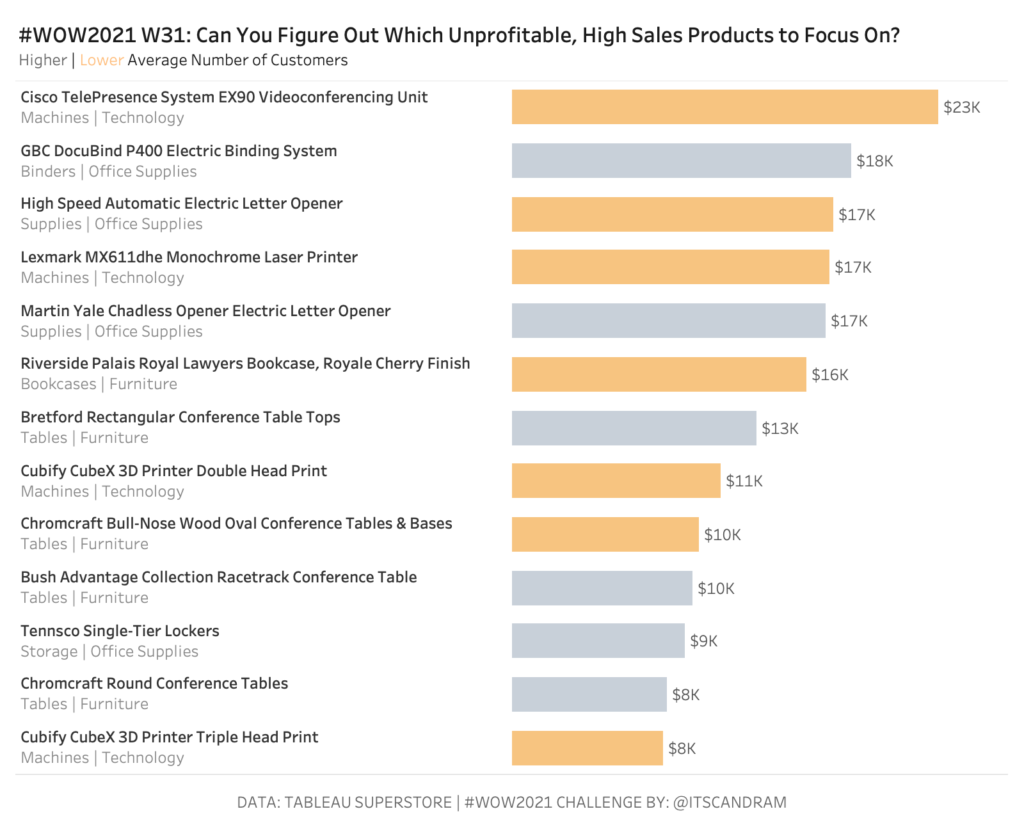
2021 Week 31: Can You Find the Needle in the Haystack?

Introduction The ability to efficiently find the proverbial needle in a haystack is worth its weight in gold.  How many times has a key stakeholder asked you to give them a shortlist of products (insert the focus of your analysis) to focus on for business improvement/optimization opportunities…and they’ve asked you to get back to them …

2021 Week 31: Can You Find the Needle in the Haystack? Read More

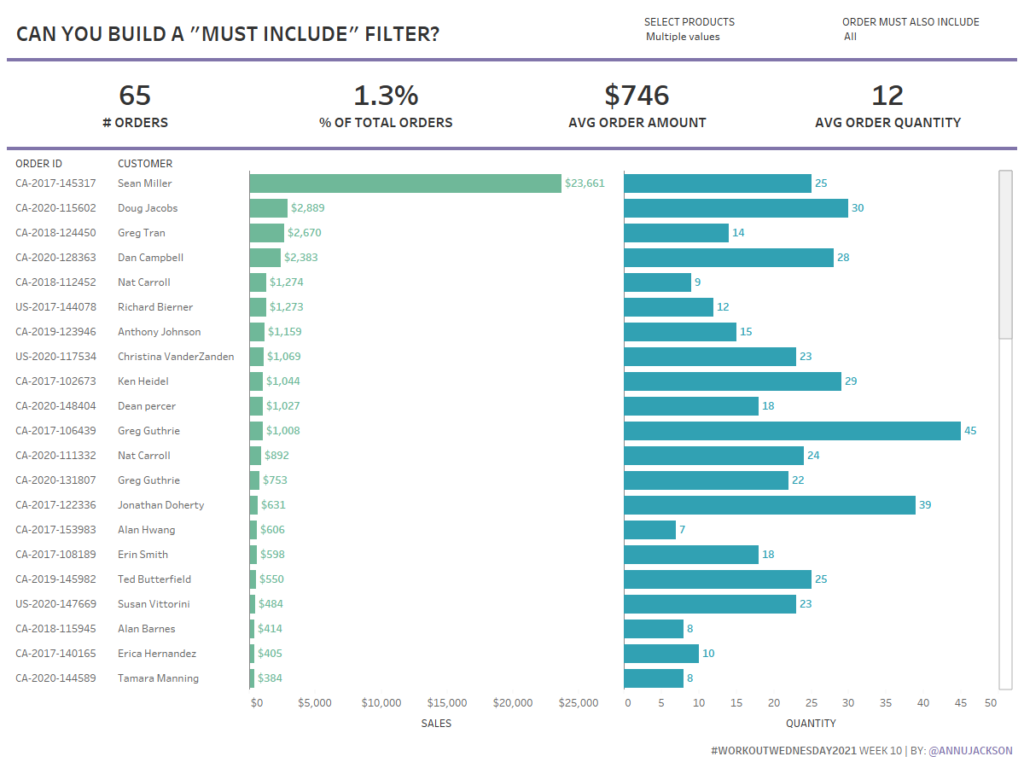
2021 Week 10 | Tableau: Can you build a must include filter?

Introduction This week’s challenge is pulled directly from a work challenge I encountered recently.  The ask was to build a filtering system that would allow the user to initially filter data and then add a secondary requirement of inclusion. Using the Superstore data set, the functionality we wanted to achieve was: Allow user to filter …

2021 Week 10 | Tableau: Can you build a must include filter? Read More

2020 Week 21: Can you design for an automatic phone layout?

Introduction Creating the perfect dashboard requires time and patience, do we put the same amount of effort into creating dashboards ready made for mobile. This weeks shows how best to build a desktop dashboard for the automatic mobile layout. As mentioned by Bridget Cogley. Tableau’s automatic phone layout follows the a-z pattern. So top left …

2020 Week 21: Can you design for an automatic phone layout? Read More

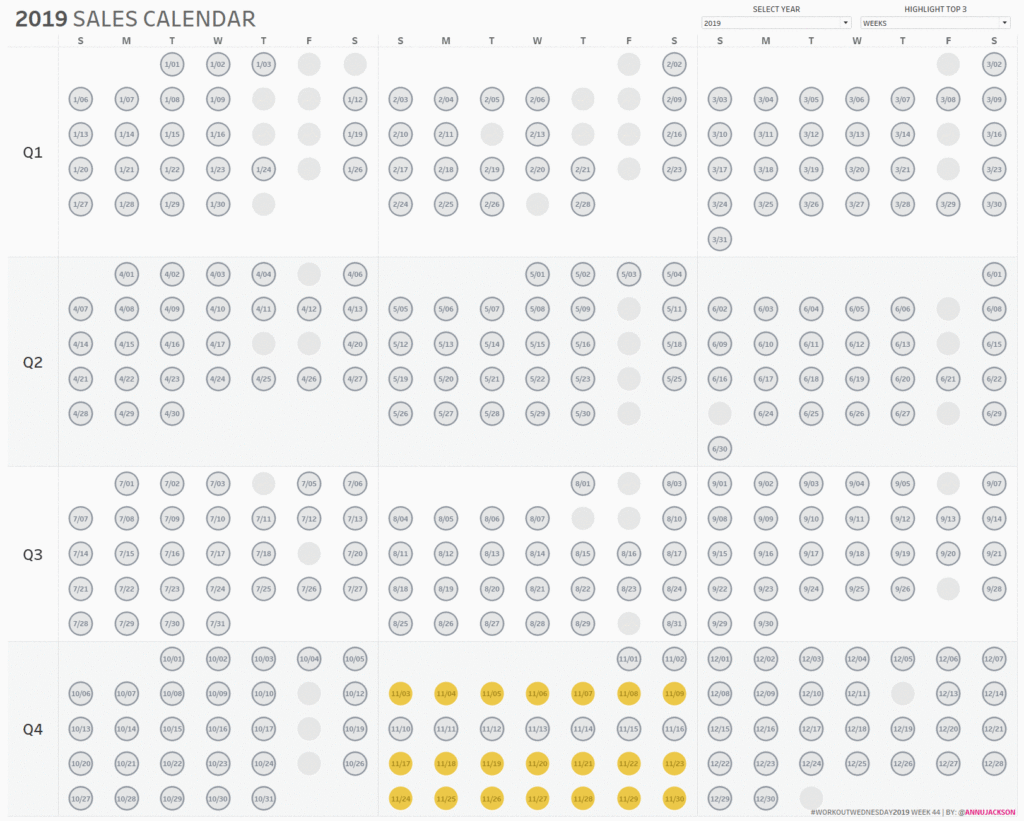
Week 44: Can you build a Sales Calendar with top 3 highlighting?

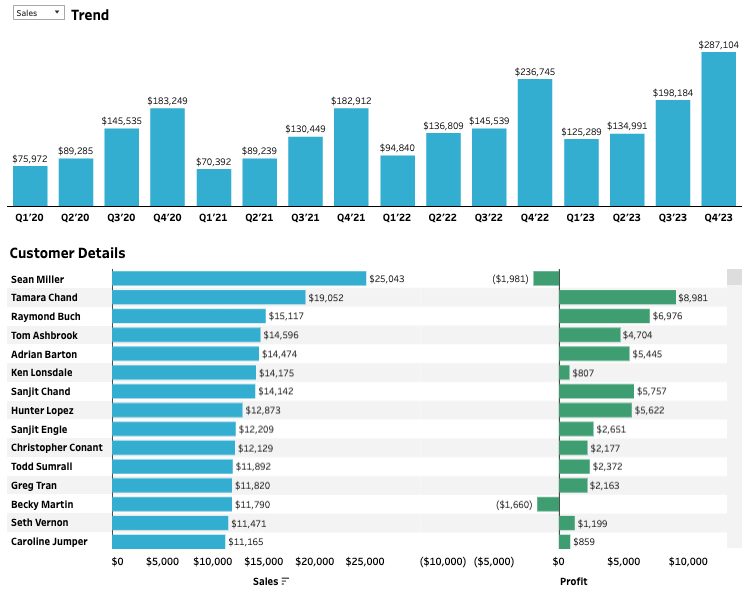
This week’s workout comes from a recent conversation I had.  The goal was to figure out the best periods of sales (whether that was best days, best weeks, or best months) and to understand more context around those dates.  Was the increase in sales driven by holidays or other external events, or perhaps it was …

Week 44: Can you build a Sales Calendar with top 3 highlighting? Read More

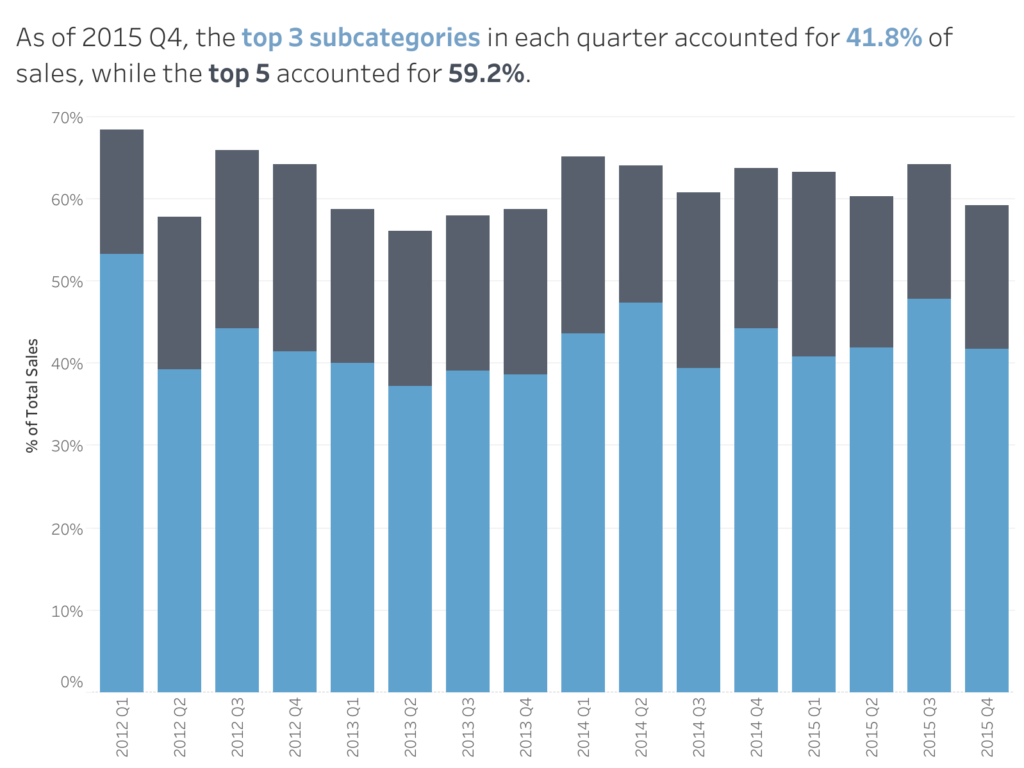
#WOW2017 | 25 | Top 3 vs Top 5

Introduction This challenge is hosted on Andy’s website – check it out here  Click to open in Tableau Public Attribute When you publish your solution on Tableau Public make sure to take the time and include a link to the original inspiration.  Also include the hashtag #WOW2017 in your description to make it searchable! Share After …

#WOW2017 | 25 | Top 3 vs Top 5 Read More

Scroll to Top