Introduction
Over the course of #WorkoutWednesday’s long and storied history, we’ve given the community 250 challenges since 2017 and while we don’t have the exact numbers, I’d be willing to wager that the majority of the challenges involve Table Calculations. In fact, recently we surveyed the community and table calcs are right up at the top of the list of challenges you want more of.
But one thing I don’t think we’ve done with table calcs (I don’t think) is how to implement filtering into table calcs WHILE NOT affecting the scope of said table calc.
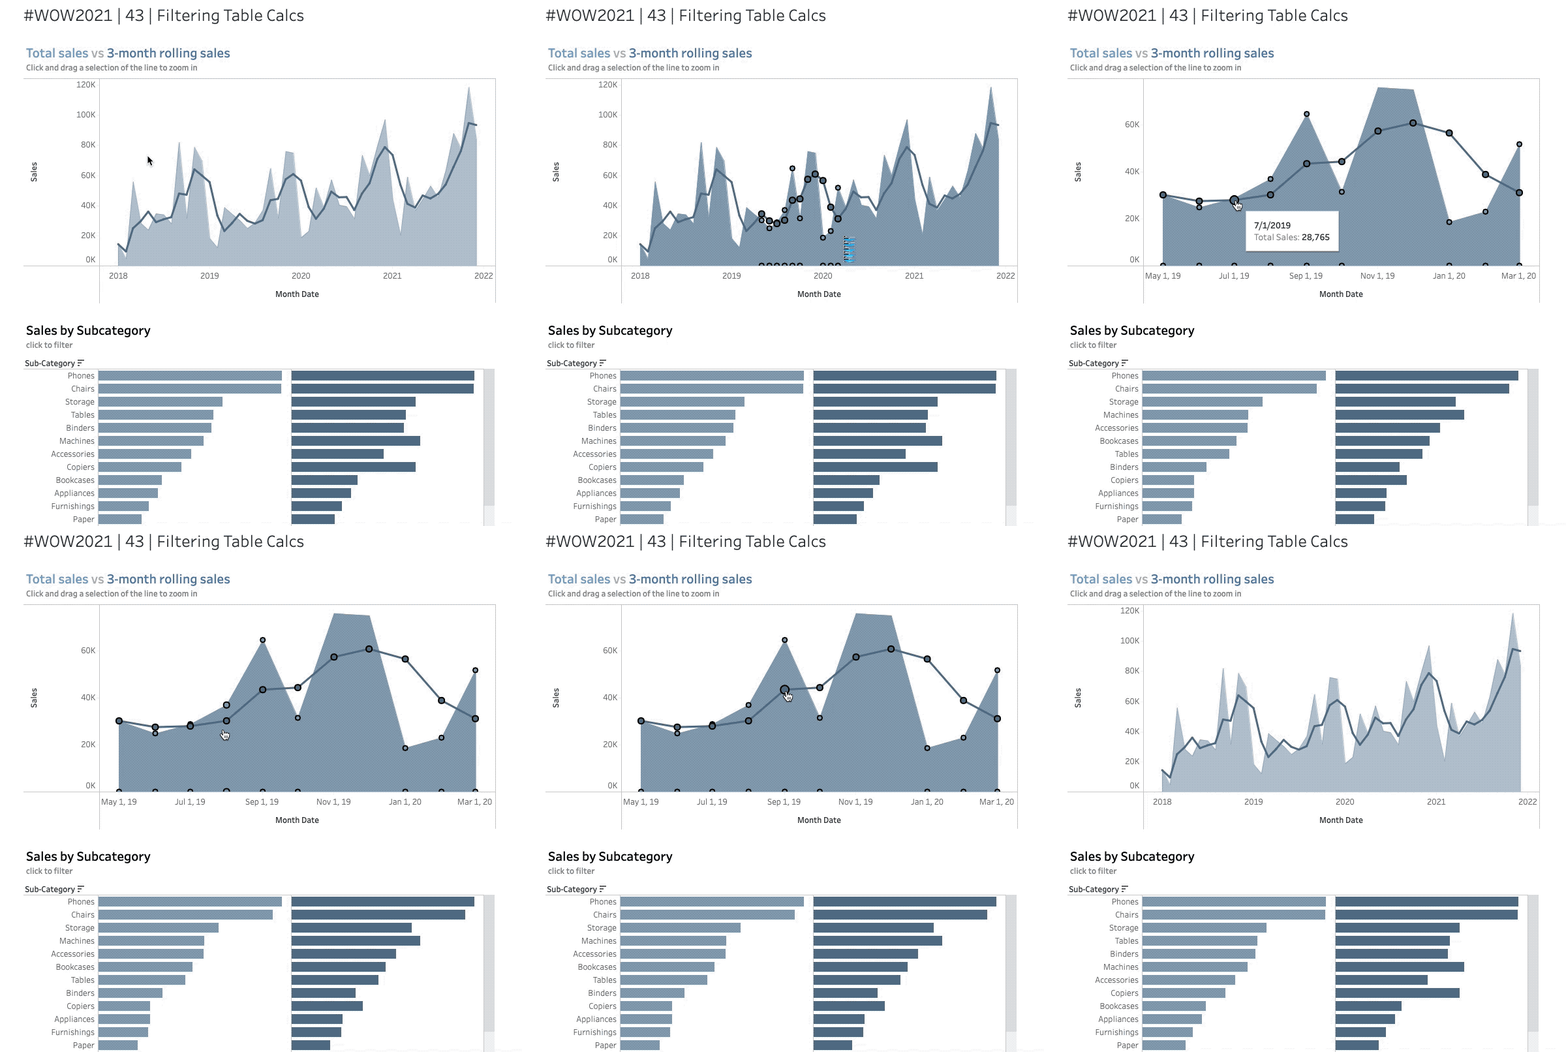
That’s what this challenge will do! We’ve got a simple dashboard of sales vs a 3-month rolling avg of sales. And users can click+drag to select a portion of the line chart to ‘zoom in’ to that time period which will filter the date range to the selected time frame but WILL NOT reset the table calculation.
Are you up to the challenge?
Oh I almost forget to mention the other fun requirement – complete entirely within web authoring on Tableau Public!
Requirements
- Build entirely in web authoring on Tableau Public – yes, you have the desktop app but your explorer users do not, let’s live in their world this week 😀
- Dashboard Size: 800px by 1000 px
- Create a layered area chart for Total Sales by month and line showing the 3-month rolling avg of sales
- Create a side-by-side bar chart showing total sales and Avg. Monthly sales by sub-category
- Implement interactivity to click and drag on the area chart and/or click on a subcategory to filter the dashboard.
- Filtering the date range SHALL NOT change the rolling average values
Dataset
You have to upload a dataset to Tableau Public to begin this challenge. You can get it here at data.world
Attribute
When you publish your solution on Tableau Public make sure to take the time and include a link to the original inspiration. Also include the hashtag #WOW2021 in your description to make it searchable!

Share
After you finish your workout, share on Twitter using the hashtag #WOW2021 and tag @AnnUJackson, @ItsCandraM, @LukeStanke, @_Lorna_Brown and @HipsterVizNinja

Can a solution of the workbook be posted since I cannot download the workbook from the creator’s Tableau Public profile?