#WOW2025 | 23 | Can you build a control chart

Introduction

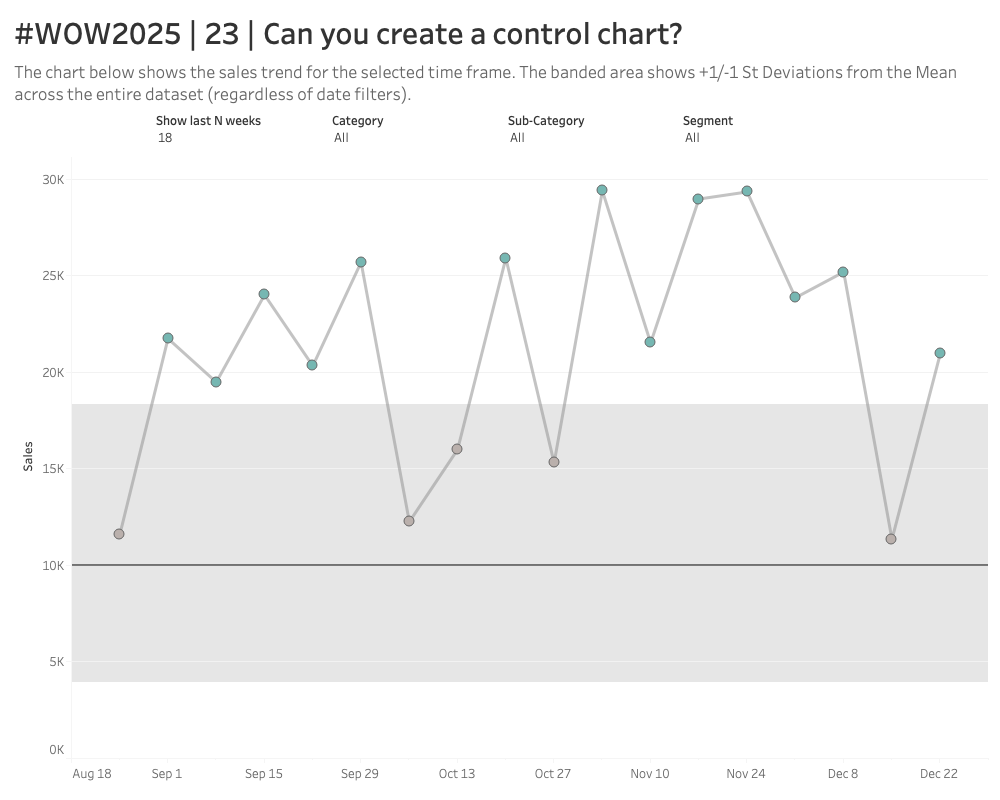
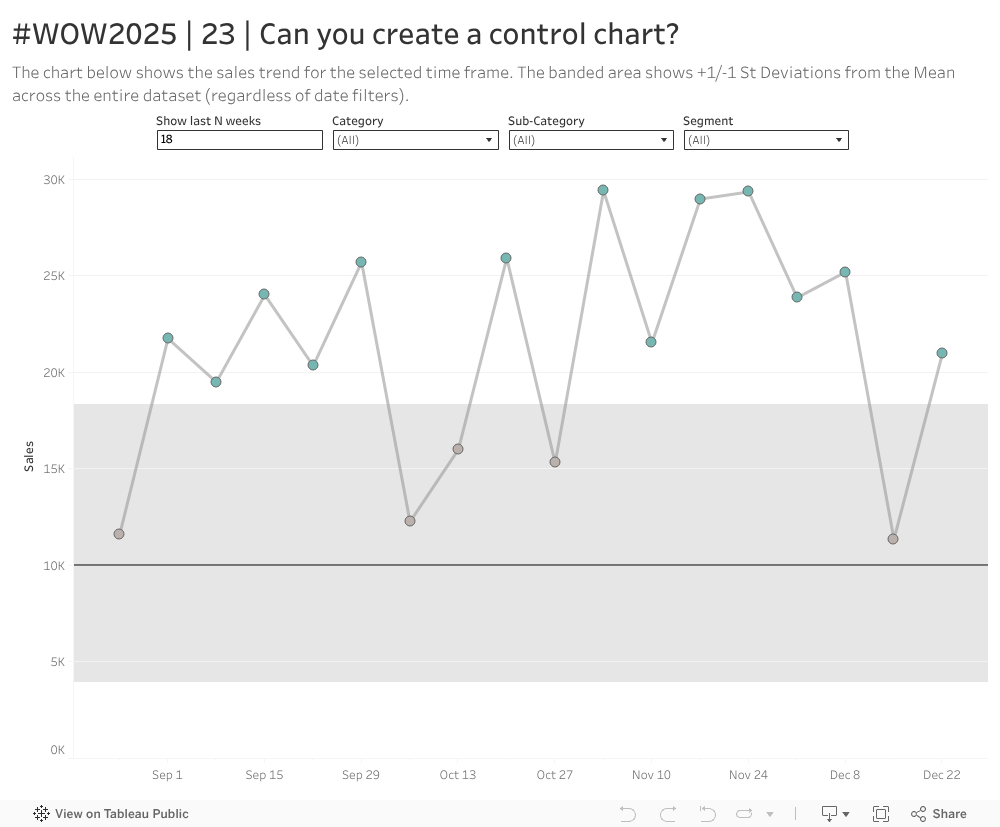
Have I ever talked about how much I love table calcs? They are super powerful and often more performant than the often overused LOD expression. So that’s what we’re going to practice this week.

Can you create a control chart only using table calcs?

Requirements

  • 1 sheet
  • create a trend chart with dynamic user-selection to show the last n weeks
  • create a reference band of showing +1 and -1 standard deviation of the entire dataset
    • the reference band should NOT change with Date filtering but will for other dimension filters
  •  create a median reference line of the entire dataset
    • the reference line should NOT change with Date filtering but will for other dimension filters
  • add dots for each value on the line and color based on performance relative to the reference band

Dataset

Available from here.

Attribute

When you publish your solution on Tableau Public make sure to take the time and include a link to the original inspiration.  Also include the hashtag #WOW2025 in your description to make it searchable!

Share

After you finish your workout, share on Twitter and/or LinkedIn using the hashtag #WOW2025 #Tableau and tag @WorkoutWednsday

Solution

Interactive

Scroll to Top