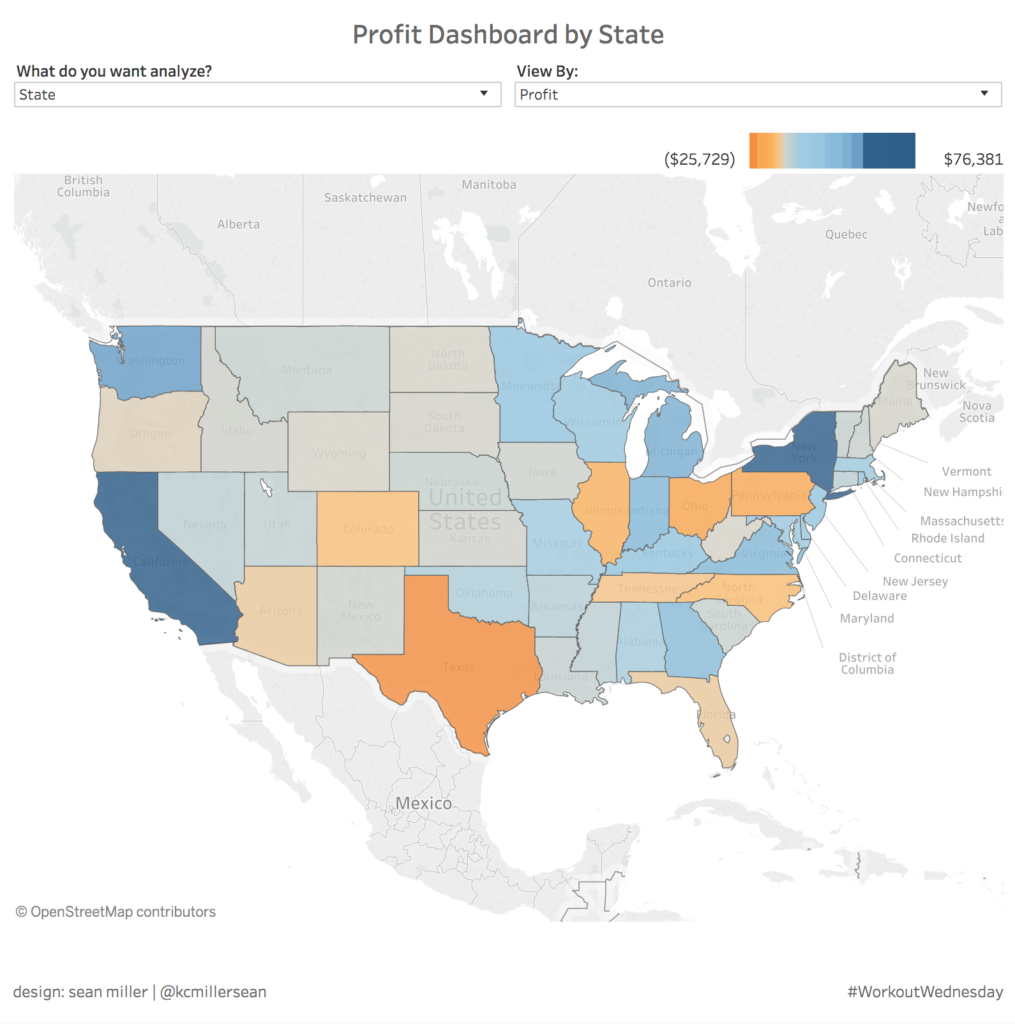
Week 31: Dynamic Color Legend
August Community Submission Month Welcome to community submission month. For all 5 of those weeks we’ll have our favorite community submissions as challenges. FYI: You can still submit here. Community Submission Challenge #1: Sean Miller Our first community challenge comes from Sean Miller. Sean is located in Kansas City, Missouri in the United …