2026 Week 19 | Sigma: AI Credit Risk Analysis
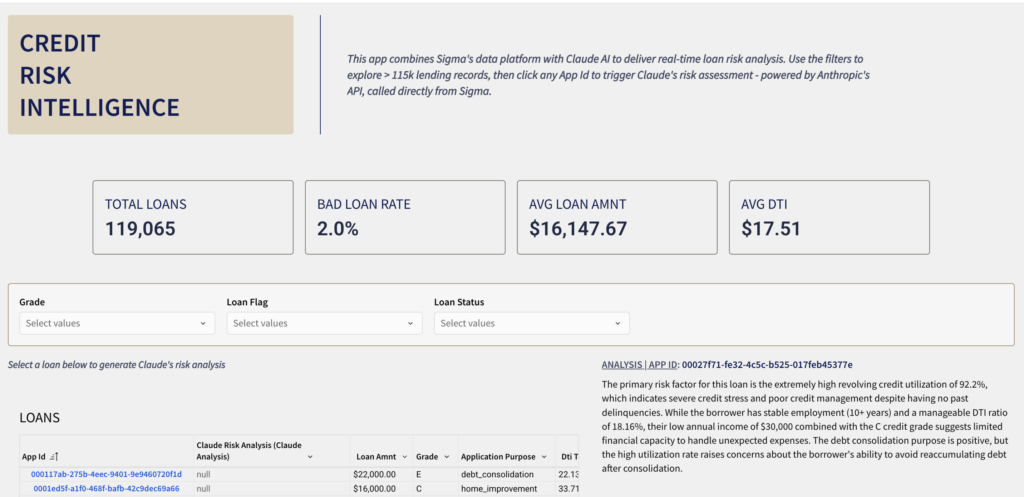
Introduction This week’s challenge explores something entirely new for Sigma – calling an external AI API directly from a workbook action. Using Sigma’s API Connector and Action Sequences, you’ll build a Credit Risk Intelligence app that sends live loan data to Claude’s AI and displays a real-time risk explanation – all without leaving Sigma. Need Access […]
2026 Week 19 | Sigma: AI Credit Risk Analysis Read More »
Sigma, Workout Wednesday