Daniel Marsh-Patrick

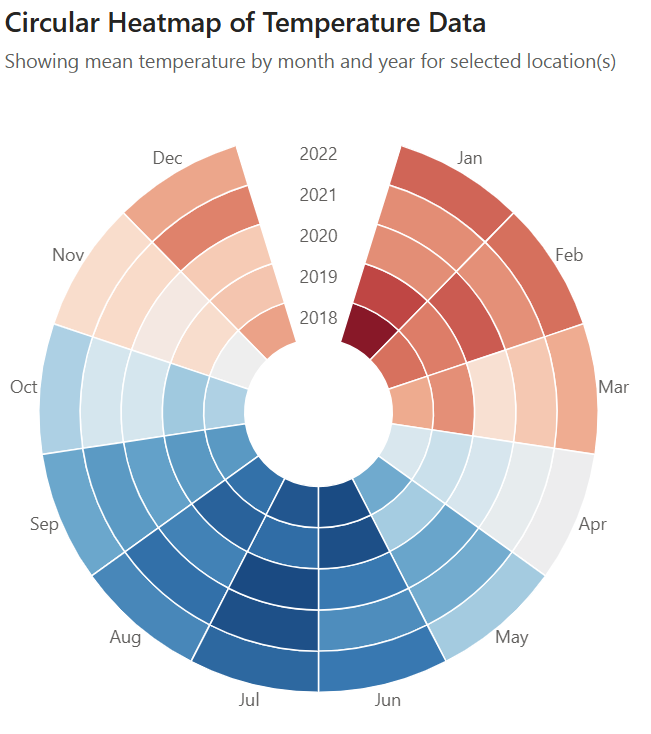
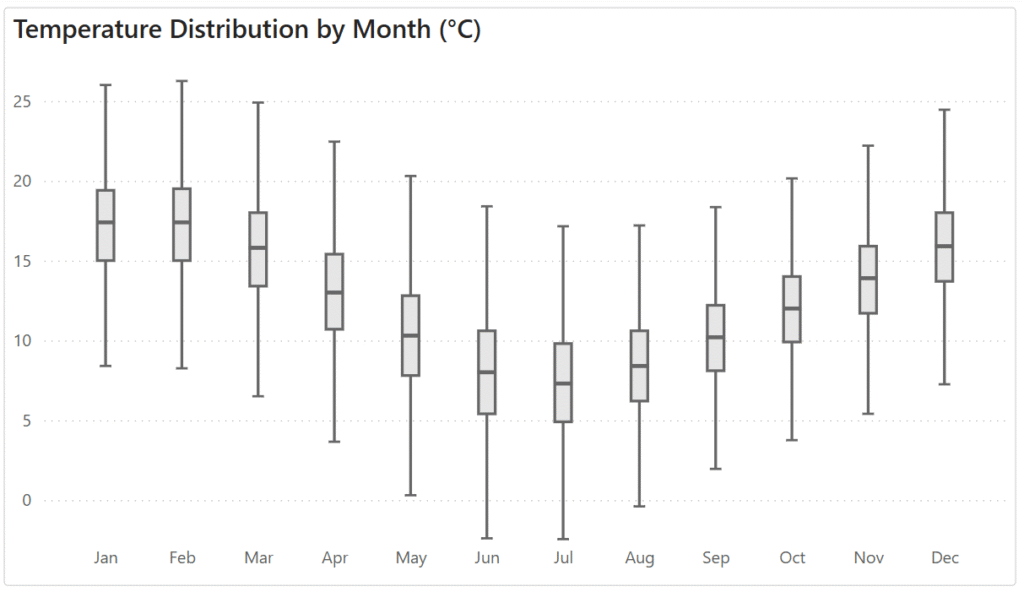
Screenshot of a box plot created using Power BI.

2025 Week 24 | Power BI: Core Visuals Box Plot

Introduction It’s nice to be invited back by the team, and thanks for having me! While it’s tempting for me to think of something for you explore with the Deneb or HTML Content custom visuals (and I’d still encourage that!), I’d like to continue some of the other threads we’ve recently seen around what we …

2025 Week 24 | Power BI: Core Visuals Box Plot Read More

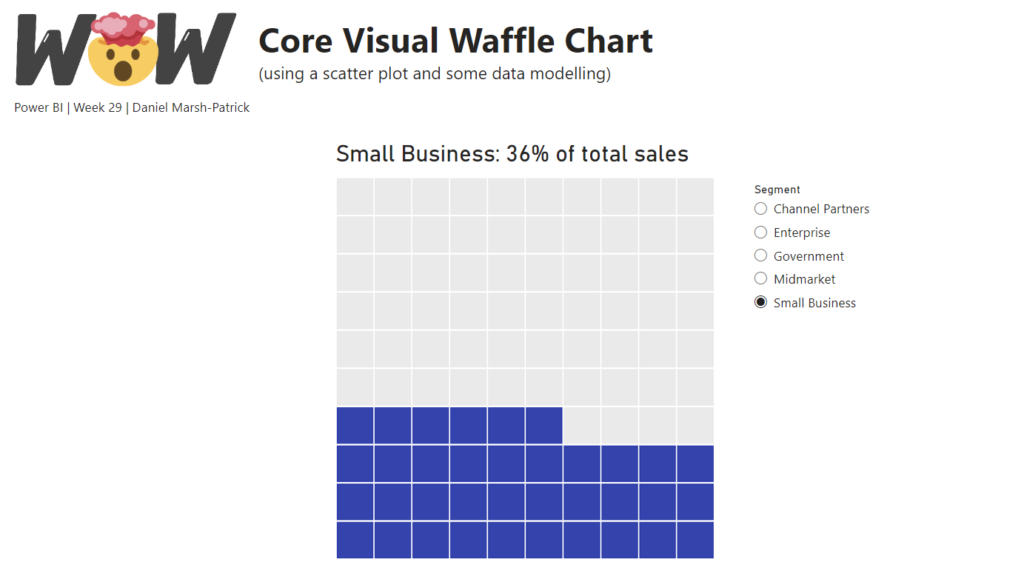
Waffle chart created with core visuals

2023 Week 29 | Power BI: Core Visual Waffle Chart

Introduction If you’re as old as I am, you might remember MacGyver. For eight-year-old me, he was simply the coolest person who ever lived: he was a brilliant thinker and could get out of any situation with a Swiss Army knife and whatever was lying around. These days, to “MacGyver something” is a homage to …

2023 Week 29 | Power BI: Core Visual Waffle Chart Read More

Scroll to Top