#WOW2026 | Week 19 | Can you visualise Customer Spend Insights?
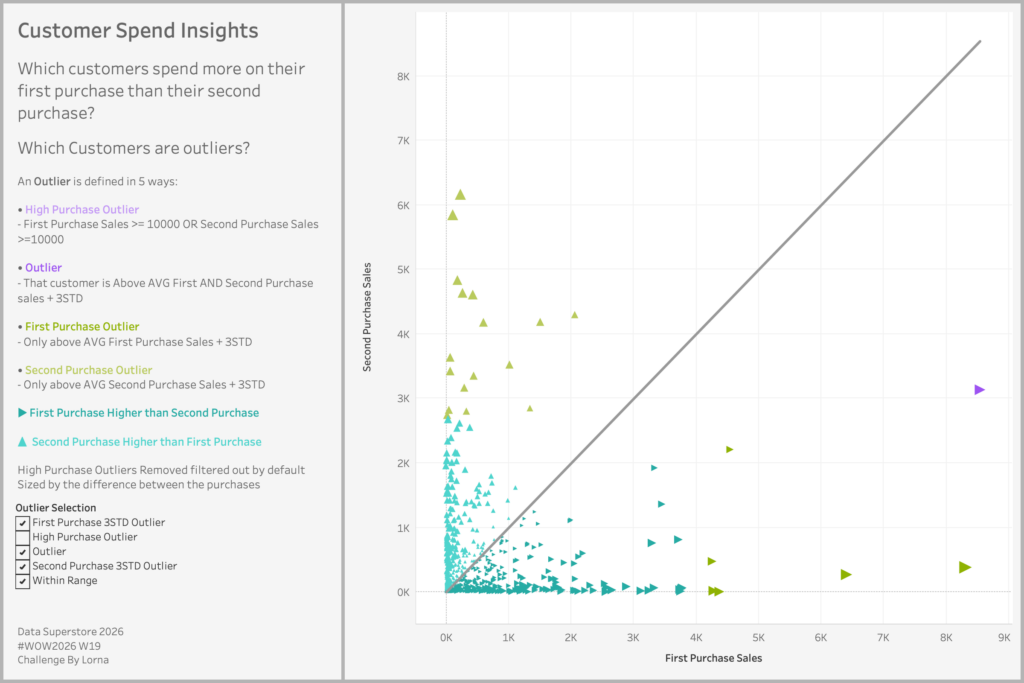
Introduction I was struggling to think of a challenge for this week, so I went back to the archives and found this one. This is looking at Customer Spend Insights, which is looking at their first & second purchase, and whether they are deemed as Outliers or not You have the option to choose between […]
#WOW2026 | Week 19 | Can you visualise Customer Spend Insights? Read More »
Tableau, Workout Wednesday