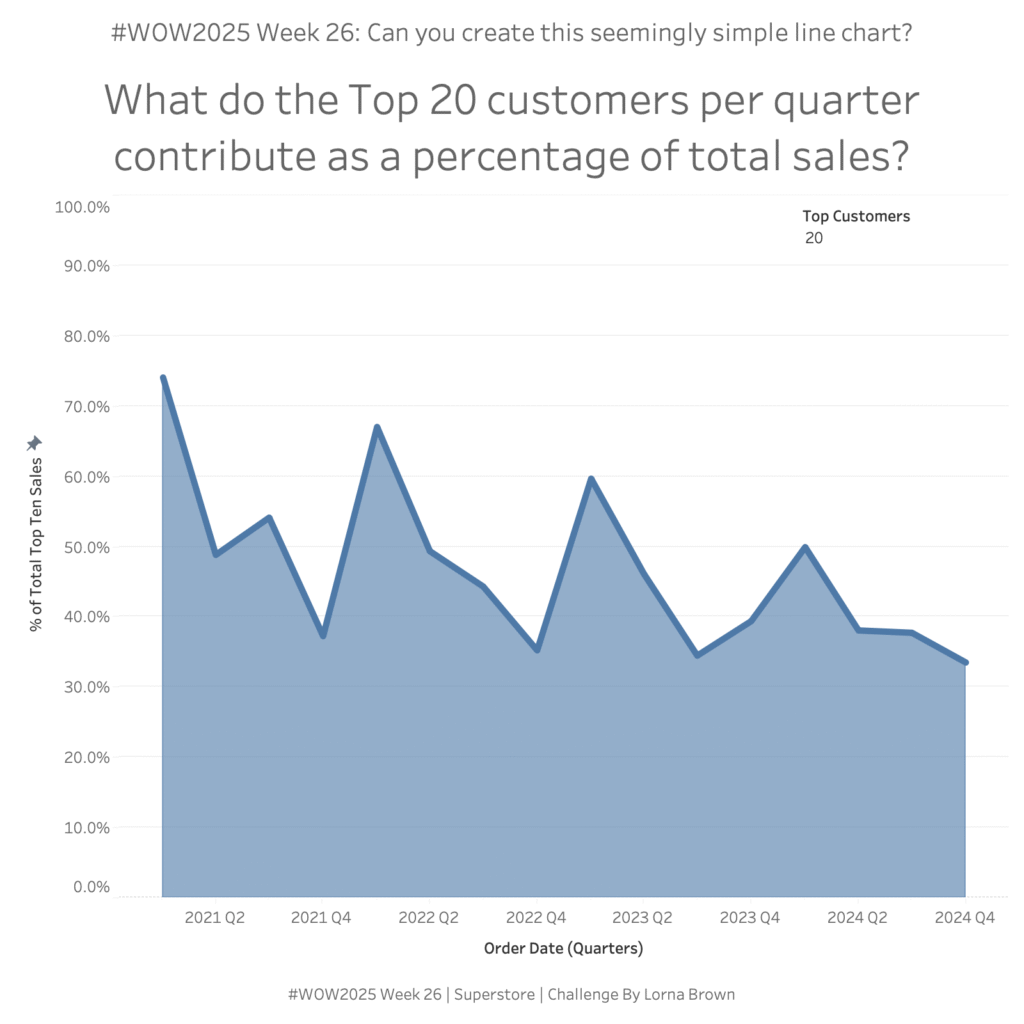
Lorna Brown

#WOW2024 | Week 27 | Can you show YTD and PYTD, whilst also being able to change the date range and switch between Month & Week?

Introduction One of the perks of my job is that I get to help colleagues solve puzzles that clients throw at them. This is where this came from. Well in fact – the original idea came from a Power BI report, and I wanted to prove it was doable in Tableau.  Click to open in …

#WOW2024 | Week 27 | Can you show YTD and PYTD, whilst also being able to change the date range and switch between Month & Week? Read More

#WOW2024 Week 15: Can you create a (super) dynamic trellis chart?

Introduction Continuing with our community month, I decided to invite the OG himself back for a challenge, Andy Kriebel. All I’m going to say about this challenge is, I’m sorry if it’s super hard and don’t be afraid to sneak a peak into the actual workbook to get insight into how Andy’s mind works! Click …

#WOW2024 Week 15: Can you create a (super) dynamic trellis chart? Read More

#WOW2024 | Week 3 | Can you dynamically zoom into a clustered area?

Introduction This week I wanted to test out one of Tableau’s new features, Dynamic Axis Ranges. In this exercise you want to be able to zoom into some of those clustered countries which you can then hover over to get more information about. There are, of course, some other features within this visualisation. You might …

#WOW2024 | Week 3 | Can you dynamically zoom into a clustered area? Read More

2023 W49: Can you find how many quarters it took for a customer to order again?

Introduction This week I wanted an easier challenge in the lead up to the Christmas Holidays. So what better way than doing some Level of Detail calculations. I want you to be able to find out how many quarters it took for a customer to make their second purchase Click to open in Tableau Public …

2023 W49: Can you find how many quarters it took for a customer to order again? Read More

#WOW2023 W31: Can you find the most popular sub-category by sales per state?

Introduction I am a big fan of Level of Detail calculations and this one is an oldie but goodie! That is the main focus this week, but also uses Parameter Actions & Viz in Tooltips.  Click to open in Tableau Public Requirements Dashboard Size: 600 x 600 Two Sheets Find the most popular sub-category by …

#WOW2023 W31: Can you find the most popular sub-category by sales per state? Read More

#WOW2023 Week 25: Can you calculate a percent difference between a range of dates?

Introduction I saw this visualisation floating around my twitter and trending on Tableau Public and thought it would make a great challenge for Workout Wednesday. Big thanks to Jacob for letting me use his visualisation as inspiration today! In this weeks workout, I want you to look at the percent change between two dates, we …

#WOW2023 Week 25: Can you calculate a percent difference between a range of dates? Read More

Scroll to Top