Michal Shaffer

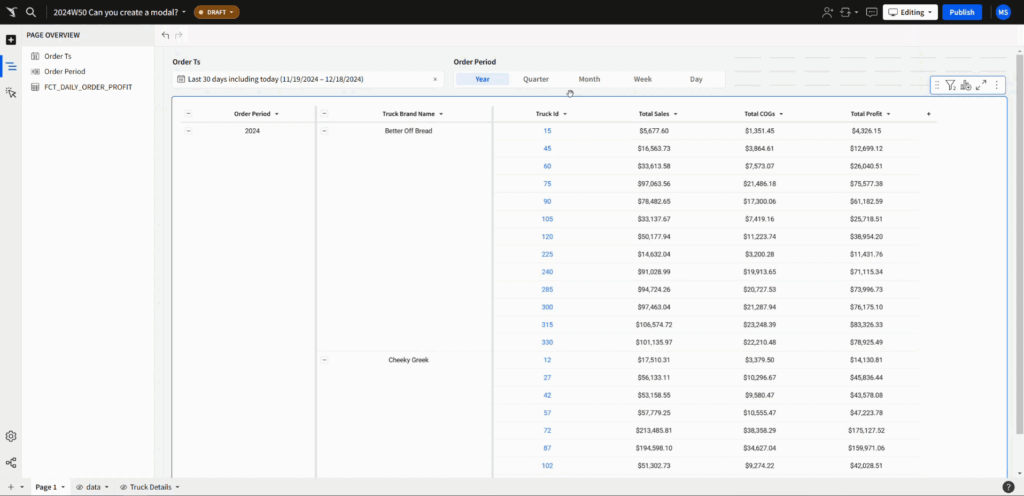
2024 Week 50 | Sigma: Can you create a Modal?

Introduction Welcome to Week 50! This week we’re playing with a new Sigma feature – modals! Modals are pop-ups that can contain any elements that you might otherwise have in another tab. There is so much opportunity with this feature, particularily when combined with actions! The formatting styles and colors in this challenge are all …

2024 Week 50 | Sigma: Can you create a Modal? Read More

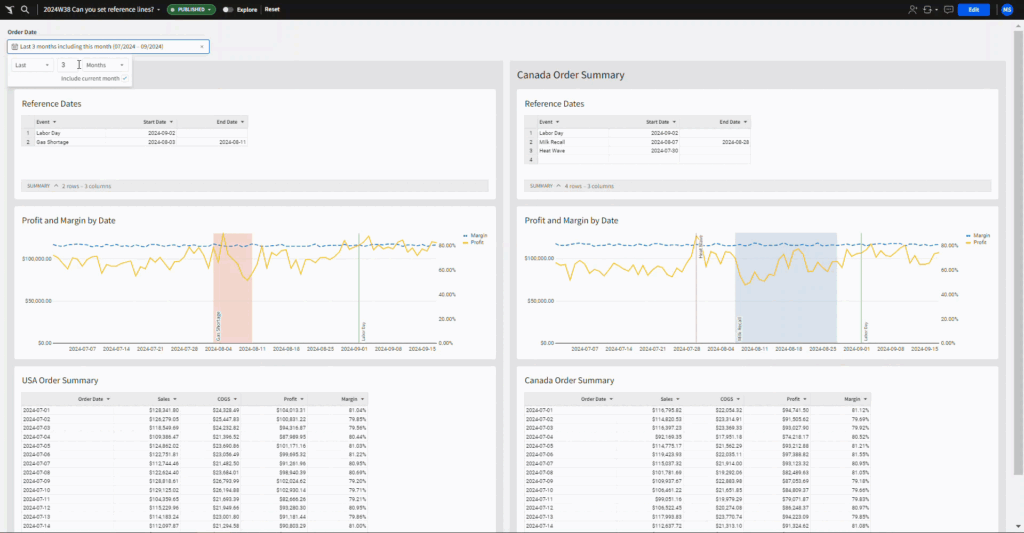
2024 Week 38 | Sigma: Can you create reference marks?

Introduction Welcome to Week 38! Sometimes there are events or notable data points that aren’t stored in your data, but you want to see how they effect the trends. Enter reference marks and conditional formatting! This week we practice using reference marks and conditional formatting to highlight specific dates and events. The formatting styles and …

2024 Week 38 | Sigma: Can you create reference marks? Read More

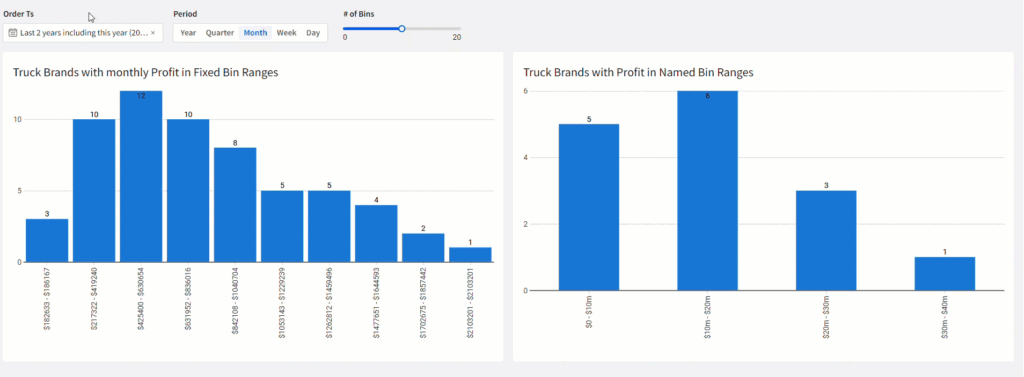
2024 Week 34 | Sigma: Can you create a Histogram?

Introduction Welcome to Week 34! Creating a histogram in Sigma is easy when you use the built-in Bin functions to divvy up your data. This week we’ll be creating a histogram using a two different Bin functions in Sigma and some controls to make the charts more dynamic! The formatting styles and colors in this …

2024 Week 34 | Sigma: Can you create a Histogram? Read More

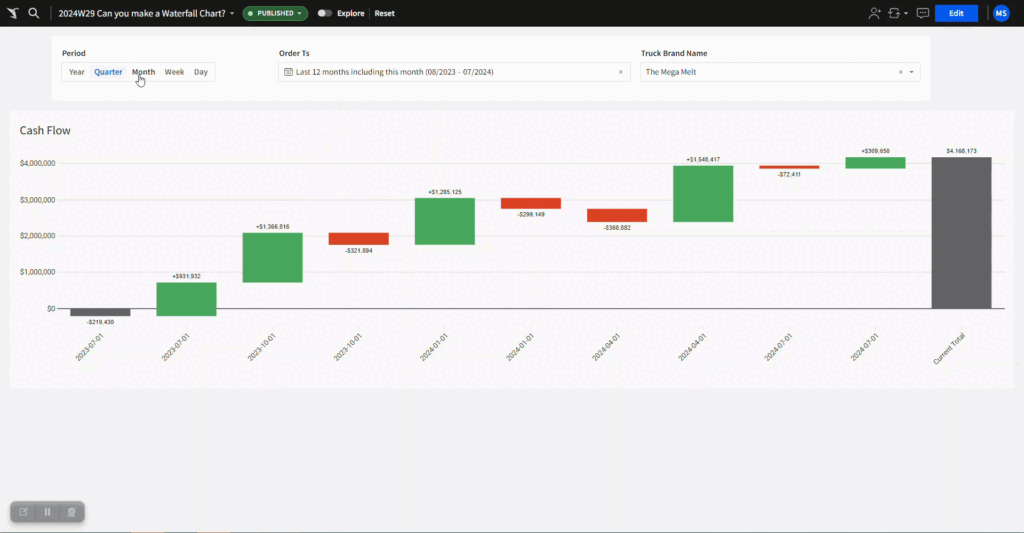
2024 Week 29 | Sigma: Can you create a Waterfall Chart?

Introduction Welcome to Week 29! When dealing with time series data, sometimes we want to see how the data changes from period to period, specifically how it increases and decreases. Enter, the waterfall chart. Waterfall charts are a great way to see the journey of a value from start to end, and to see how …

2024 Week 29 | Sigma: Can you create a Waterfall Chart? Read More

2024 Week 26 | Sigma: Can you calculate RunRates?

Introduction Welcome to Week 26! When we dive into monthly data, it’s often more helpful to predict the current month’s numbers rather than relying on incomplete data for an incomplete month. This week, we’re trying out three different ways to estimate sales projections for the ongoing month, also known as the run rate. Dealing with …

2024 Week 26 | Sigma: Can you calculate RunRates? Read More

2024 Week 18 | Sigma: Can you consolidate data?

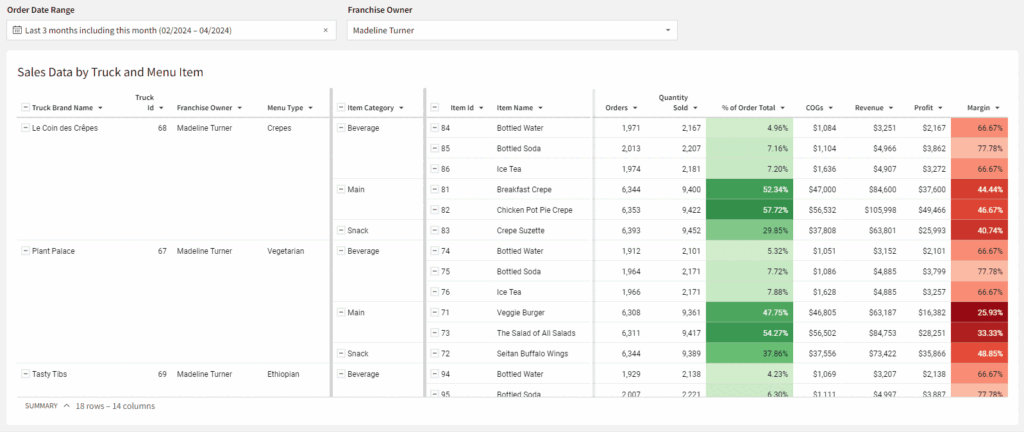
Introduction Welcome to Week 18! This week we’ll be consolidating menu item data and sales data from Sigma’s sample food trucks database using a powerful tool – Joins! We’ll use both Joins and Lookups to get a feel of the difference between the two. The formatting styles and colors in this challenge are all up …

2024 Week 18 | Sigma: Can you consolidate data? Read More

Scroll to Top