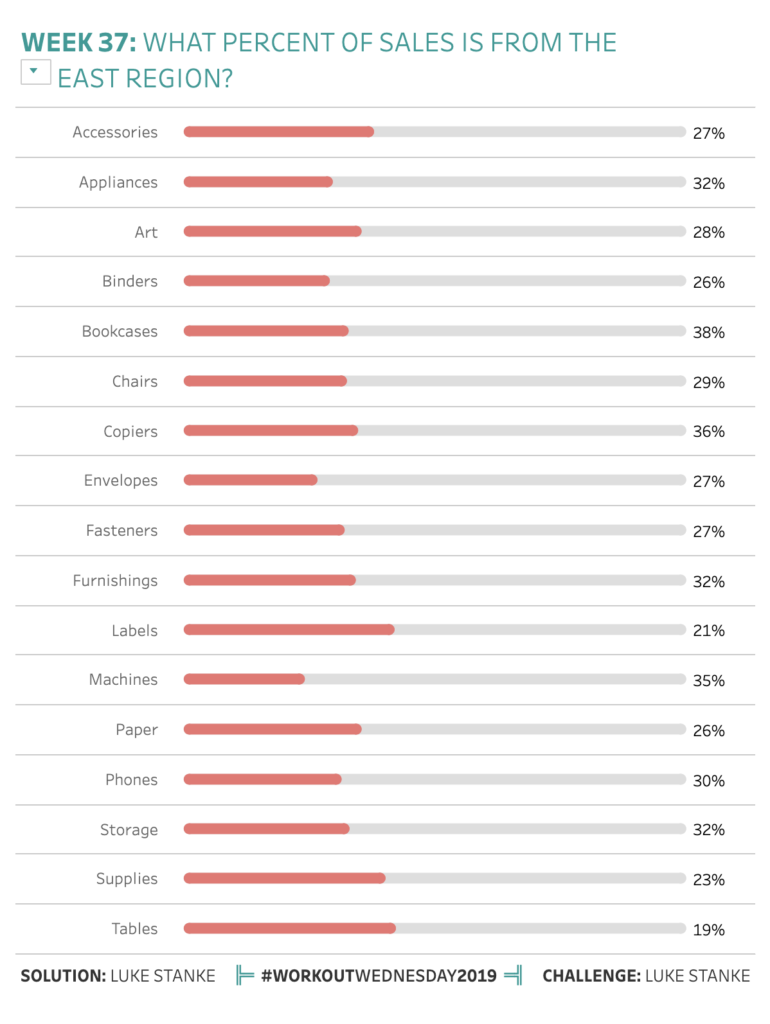
2019 Week 37: What percent of sales is from the east region?
This week we are making bar charts. Of course, this week there is a small twist to the bar charts. The ends of the bar charts need to be rounded. There are several ways to do this. I’d personally suggest unioning the data to itself–but like I said, there is more than one way to […]
2019 Week 37: What percent of sales is from the east region? Read More »
Tableau, Workout Wednesday