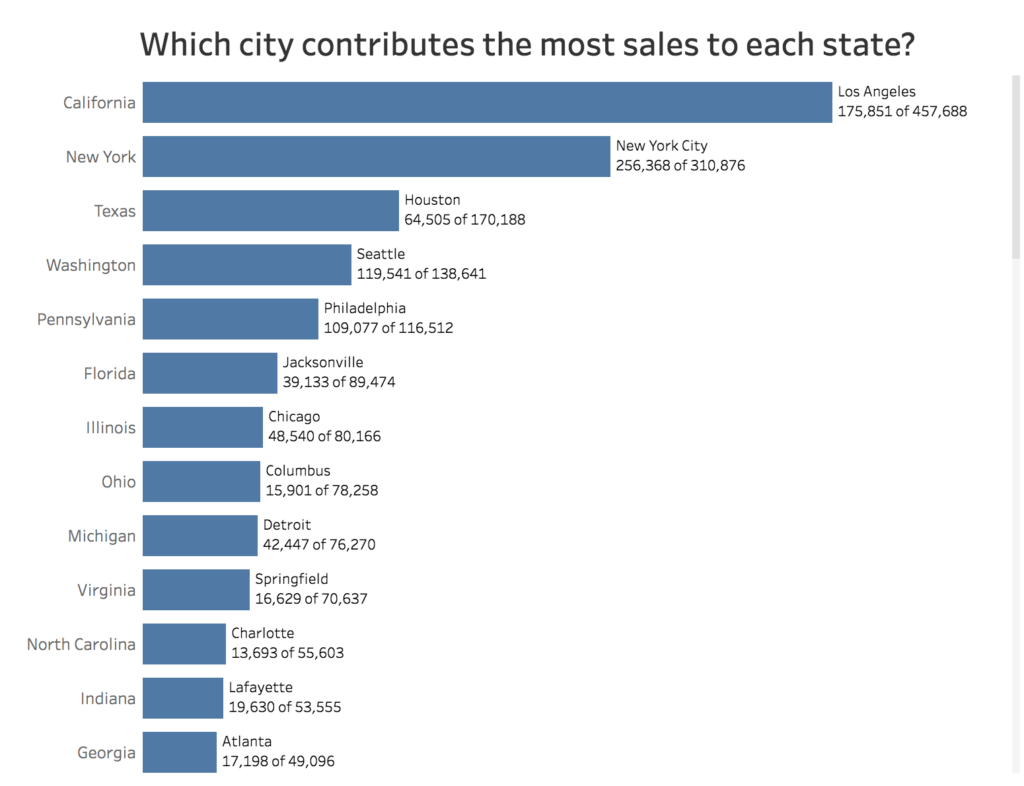
Week 22: Which city contributes the most sales to each state?
He’s back again! Andy Kriebel shares with a problem that you can only use table calculations to solve Requirements Use only table calculations The bar length is the total sales of each state City must be included in the view. Display only one mark per state. Label each bar by the city with the highest …
Week 22: Which city contributes the most sales to each state? Read More