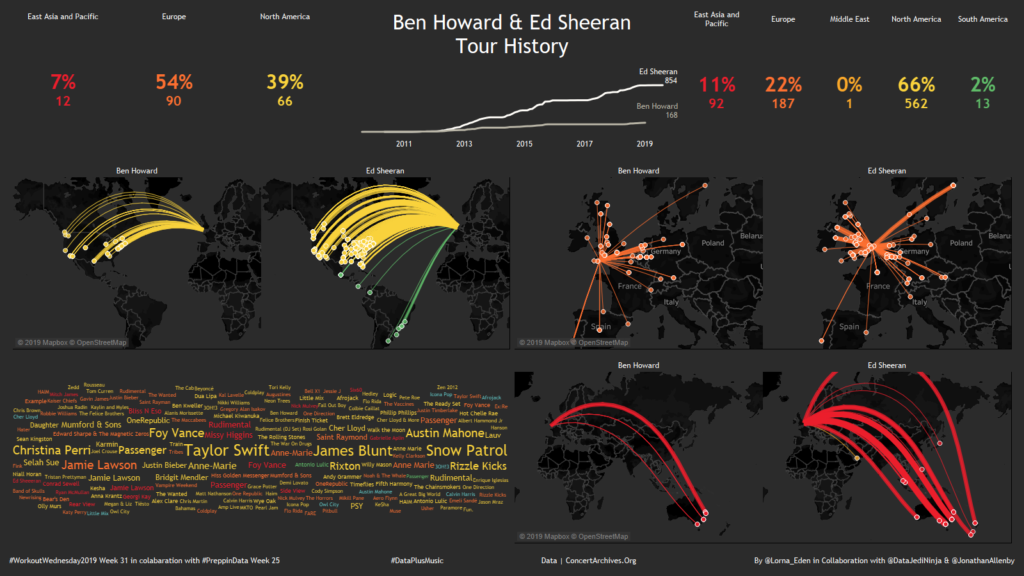
2019 Week 31: When #WorkoutWednesday meets #PreppinData? Can you create a Hub and Spoke map?
This week, alongside WorkoutWednesday we have a new collaboration, which gives you a chance to try out another community project, #PreppinData. PreppinData is a like workoutwednesday but with Tableau Prep Builder. Each week they give you a messy data set, some requirements and a finished data set, you then have to use Tableau Prep Builder …