Curtis Harris

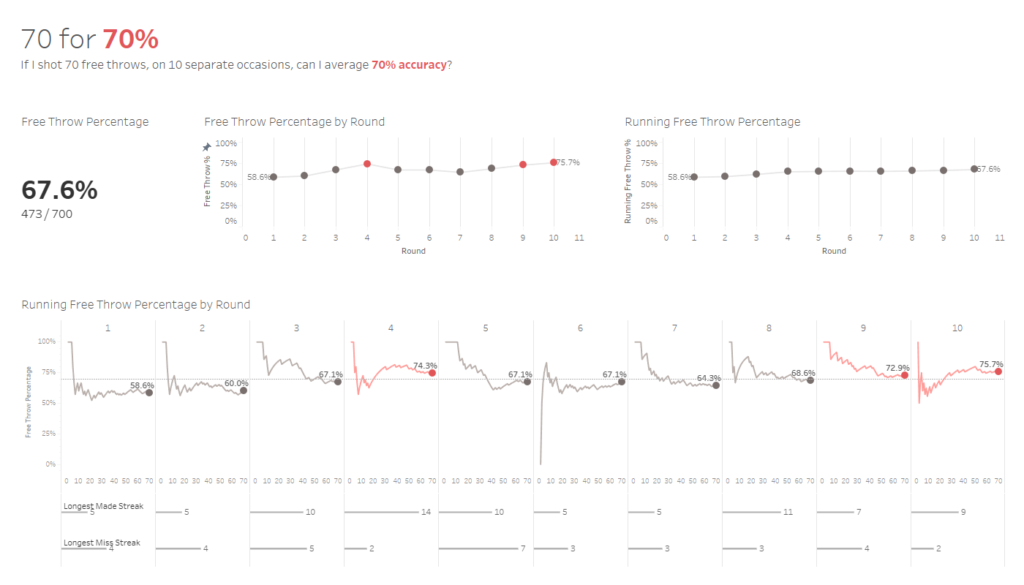
2019 Week 52: Can you visualize ones and zeros?

I feel completely honored to have spent a year working with Ann, Lorna, and Luke on this amazing project. I truly believe that Workout Wednesday is simply one of the best ways to skill up in Tableau, and if you regularly participate, you’ll quickly find yourself surpassing others in your profession and setting yourself apart …

2019 Week 52: Can you visualize ones and zeros? Read More

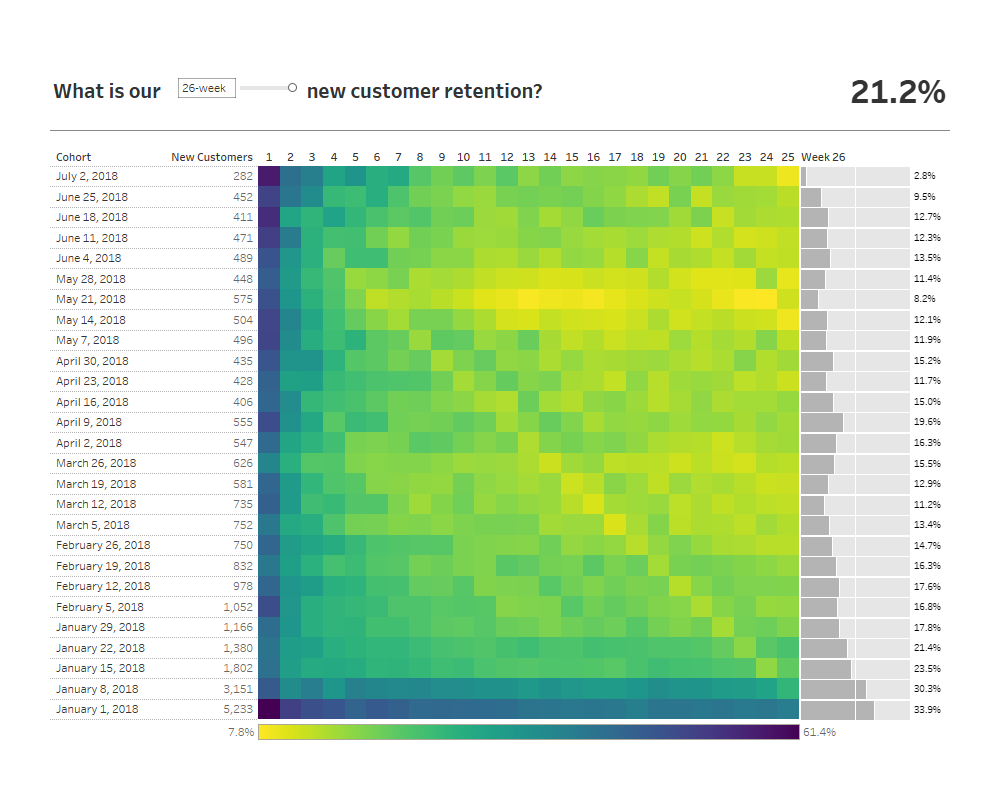
2019 Week 50: Can you build a retention heat map with a marginal histogram?

Let’s take a break from Superstore this week! I’ve fabricated some new data that will help us create a more realistic view of customer retention, you can connect to the data via the Google Sheet connector at this link. This data set has one row per order week and customer ID, representing said customer placed …

2019 Week 50: Can you build a retention heat map with a marginal histogram? Read More

2019 Week 46: Can you build a dynamic scatter plot with proportional brushing?

This is a special week for Workout Wednesday, as we are running this challenge live from Tableau Conference in Las Vegas! We’ve put together a challenge this week that is simple enough for someone who is just getting started with Tableau, tricky enough for those further along in their Tableau journey, and a great teaching …

2019 Week 46: Can you build a dynamic scatter plot with proportional brushing? Read More

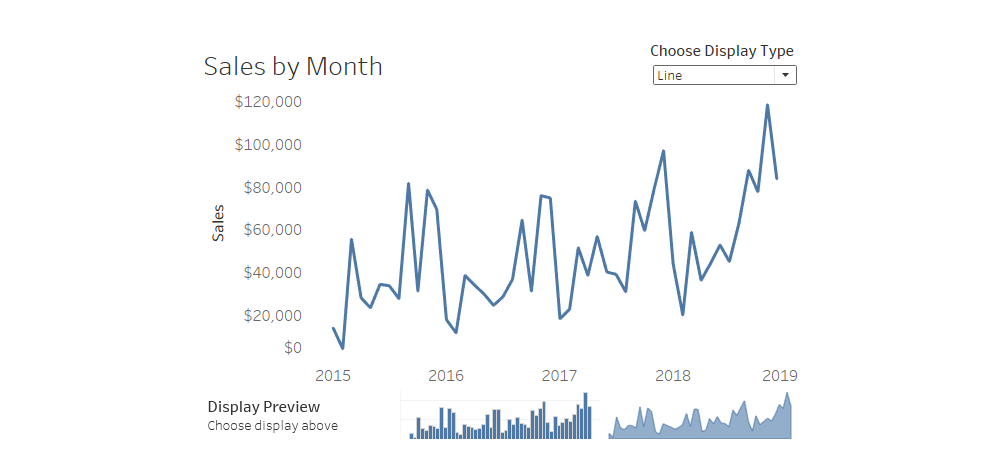
Week 40: Can you show and hide your sheets?

I was recently helping a coworker on a dashboard and mentioned sheet swapping as a potential solution to a problem. My coworker stopped me mid-sentence and said “What on earth is sheet swapping?!” We operate in our own Tableau bubble, and sometimes assume everyone else knows exactly what we do, I’m hoping Workout Wednesday is …

Week 40: Can you show and hide your sheets? Read More

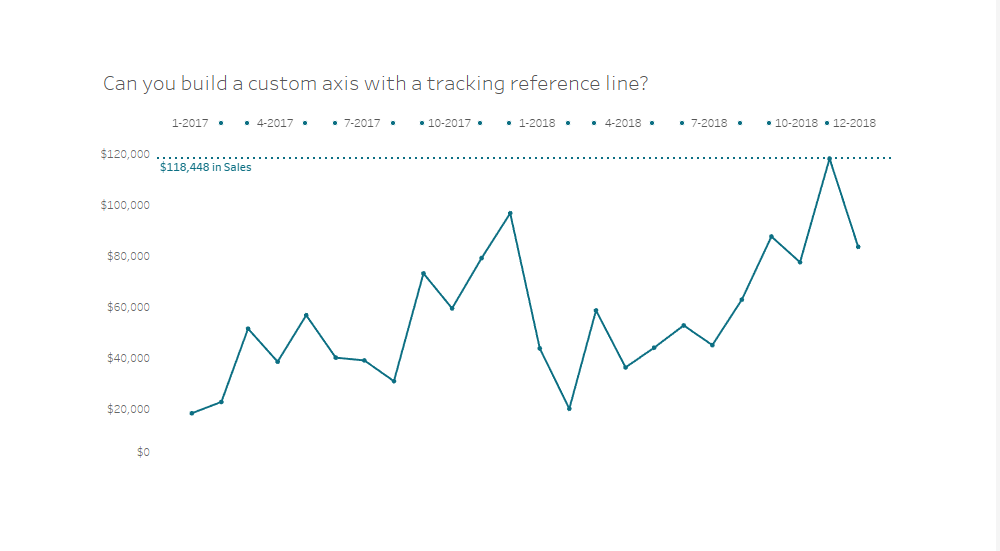
Week 36: Can you build a custom axis with a tracking reference line?

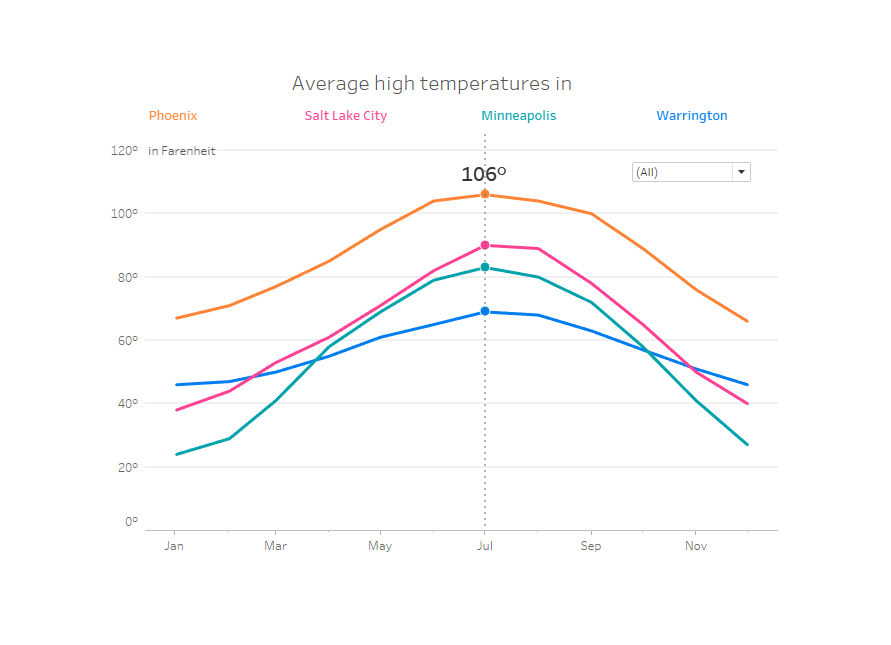
After four amazing challenges from the Tableau Community, we are back in the drivers seat to provide you with this week’s challenge! For your challenge this week, we are focused on interactivity over anything else; This week is simply about getting to know the tool and being creative with your data solutions. So can you …

Week 36: Can you build a custom axis with a tracking reference line? Read More

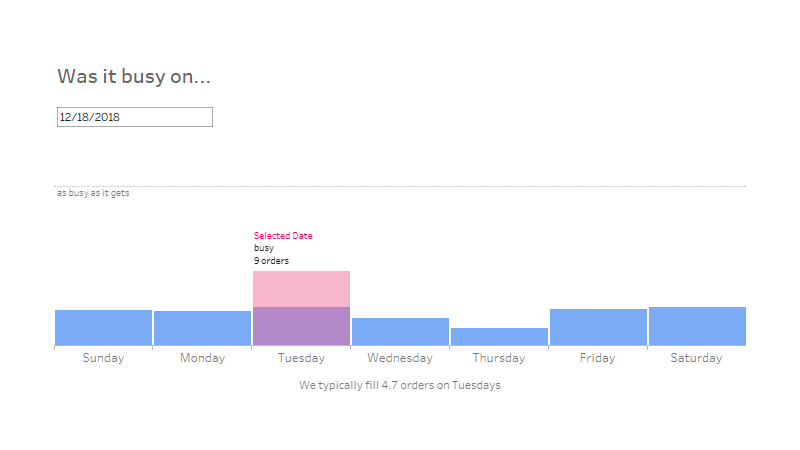
2019 Week 23: Can you get creative with bar charts?

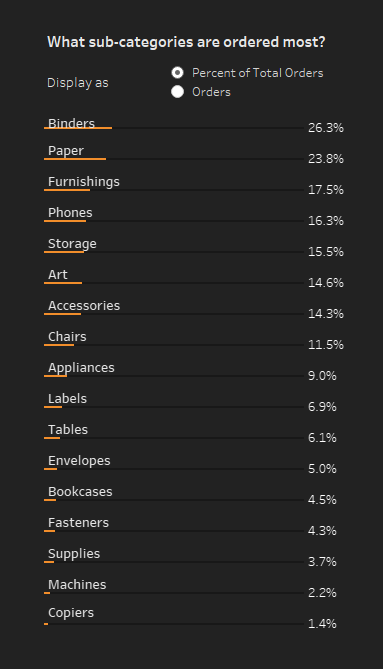
What do you do when you have limited real estate? What do you do when vanilla Tableau just isn’t going to cut it? This week’s workout should be a quick exercise designed to give you a few strategies that save on real estate, enable simple interactivity, and promote consistent design throughout your dashboards. This one …

2019 Week 23: Can you get creative with bar charts? Read More

Scroll to Top