Ashley Bennett

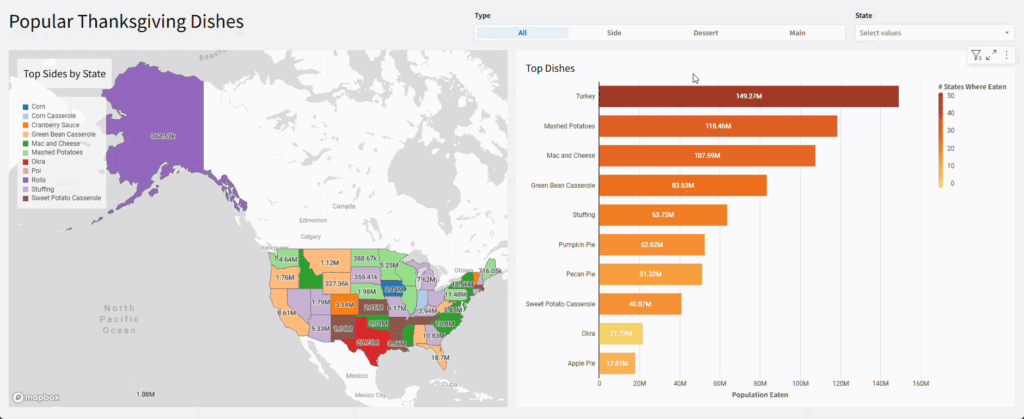
2024 Week 40 | Sigma: Can you avoid the food?

Introduction Welcome to Week Forty! In my last article,  Week 36, we covered how to affect multiple columns using the same filter.  This week, we’re going to focus on even more advanced filtering techniques.  What do you do when you want to compare multiple arrays?  Luckily Sigma recently released a brand new function:  ArrayIntersection.   In …

2024 Week 40 | Sigma: Can you avoid the food? Read More

2024 Week 36 | Sigma: Can you filter without targets?

Introduction Welcome to Week Thirty-Six! This week, we’re going to focus on some more advanced filtering.  By now, you should know how to utilize a page control’s targets to filter a single column in an element.  What do you do when you need to affect multiple columns in the same element?  You can utilize a …

2024 Week 36 | Sigma: Can you filter without targets? Read More

2024 Week 32 | Sigma: Can you pick the right columns?

Introduction Welcome to Week Thirty-Two! This week, we’re going to highlight one of Sigma’s latest enhancements to Actions.  In this challenge, you’ll add actions to controls to show or hide columns in visualizations based on the column names selected in the control.  This new action gives users more control over the data they want to …

2024 Week 32 | Sigma: Can you pick the right columns? Read More

2024 Week 28 | Sigma: Are you ready for vacation?

Introduction Welcome to Week Twenty-Eight! Now that we are firmly in Summer Mode, let’s plan a lake vacation!  This week, we’re going to evaluate water quality monitoring data in the Great Lakes.  The dataset we’re using comes from Data.Gov. This dataset has many different characteristics measured in one long table.  Don’t worry.  I’ve already created a Sigma …

2024 Week 28 | Sigma: Are you ready for vacation? Read More

2024 Week 25 | Sigma: Can you compare these populations?

Introduction Welcome to Week Twenty-Five! This week, you’re going to compare US Census data from 2000 and 2010.  In this challenge, we’ll highlight a couple of new formatting additions to Sigma, as well as create a dynamic parameter.  Good Luck!-Ashley Need access to Sigma? Click Here to Sign Up Link to WOW Sigma Instance Youtube …

2024 Week 25 | Sigma: Can you compare these populations? Read More

2024 Week 17 | Sigma: Can you Cohort These Customers?

Introduction Welcome to Week Seventeen! This week, you’re going to perform a Cohort Analysis of food truck customers based on when they placed their first order.  Conditional formatting will help highlight which cohorts have a greater percentage of customers in them. As a bonus, you will implement a dynamic page control input to let the …

2024 Week 17 | Sigma: Can you Cohort These Customers? Read More

2024 Week 14 | Sigma: It’s a Bird… It’s a Plane… It’s Lookup Functions!

Introduction Welcome to Week Fourteen! This week, you’re going to learn about Sigma’s Lookup function.  Lookups are very useful for joining information from one data source to another, without accidentally fanning your data.  Sigma also has a Lookup Wizard for a foolproof way of utilizing this function. When I book a flight, I am particularly concerned …

2024 Week 14 | Sigma: It’s a Bird… It’s a Plane… It’s Lookup Functions! Read More

2024 Week 11 | Sigma: Can you find the Subtotal?

Introduction Welcome to Week Eleven! This week, you’re going to learn about Sigma’s Subtotal, PercentOfTotal, and GrandTotal functions.  I find these functions particularly useful in adding context to ToolTips or Pivot tables. In this challenge, you will explore the various types of subtotaling functions.  As you work through this challenge, think about the story the different …

2024 Week 11 | Sigma: Can you find the Subtotal? Read More

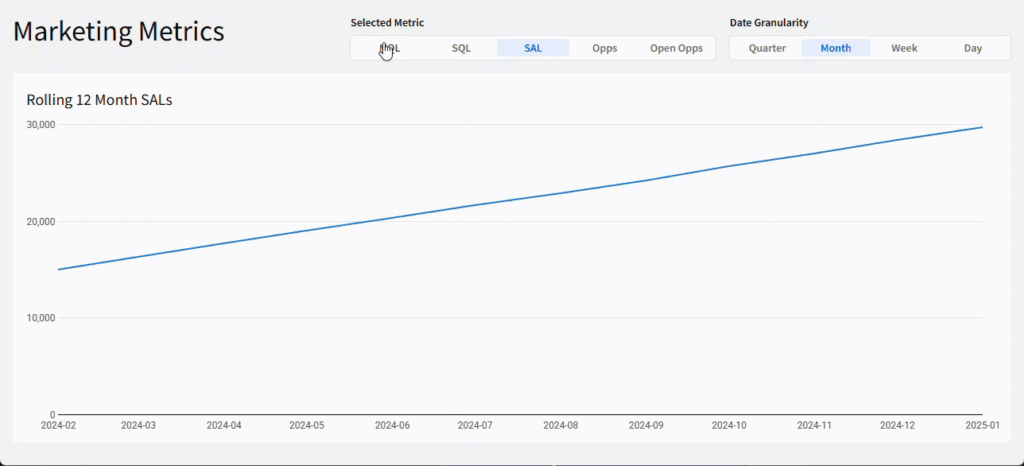
A Line Graph that changes between different date granularities

2024 Week 7 | Sigma: Can you recreate this Line Graph?

Introduction Welcome to Week Seven! This week, you’re going to create a line graph that can change its date granularity.  With a dynamic x-axis, this graph allows users to view trends at the level that makes sense for their current needs, without duplicating work. Also in this challenge, you’re going to learn how to show …

2024 Week 7 | Sigma: Can you recreate this Line Graph? Read More

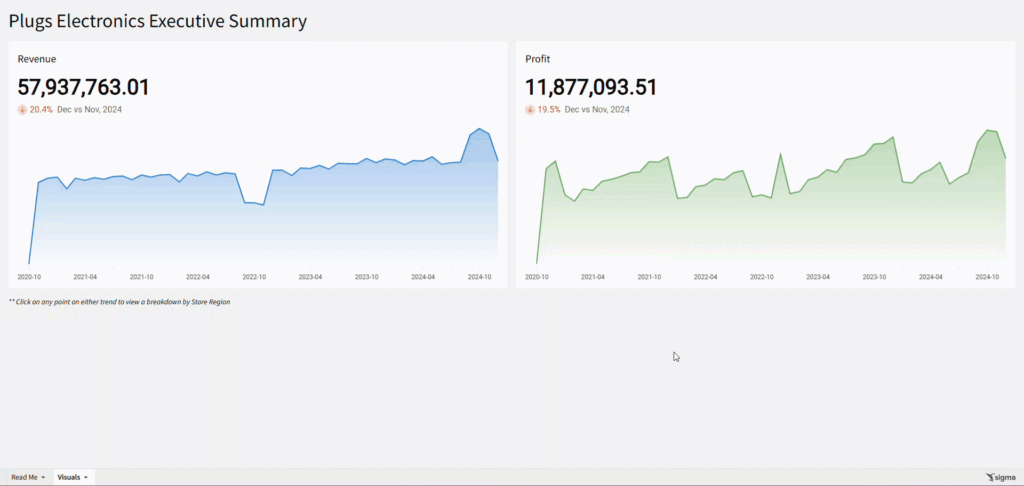
2024 Week 4 | Sigma: Can you recreate this KPI Chart?

Introduction Welcome to Week Four! This week, we’re going to create a single element that shows multiple pieces for analysis. This challenge is easier than last week, and is meant to show how quickly Sigma can perform period over period analysis on any KPI.  Good Luck!-Ashley Need access to Sigma? Click Here to Sign Up …

2024 Week 4 | Sigma: Can you recreate this KPI Chart? Read More

Scroll to Top