Ivett Kovács

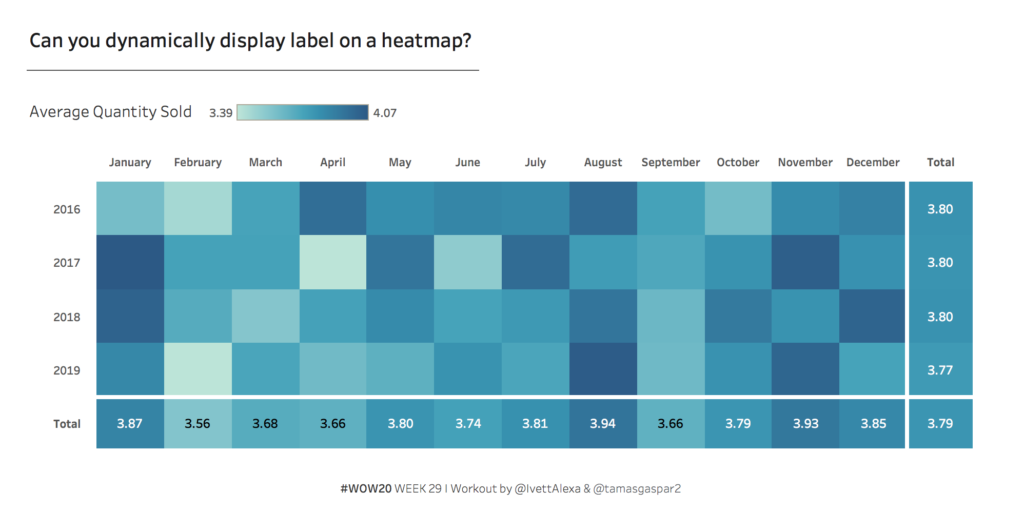
2020 Week 29: Can you dynamically display label on a heatmap?

Introduction The topic week is based on a recent project of my colleague, Tamás Gáspár, with whom I had the opportunity to make this super challenge for you guys. Heatmaps are a chart better suited to representing a more generalised view of numerical data, as it’s harder to accurately tell the differences between colour shades …

2020 Week 29: Can you dynamically display label on a heatmap? Read More

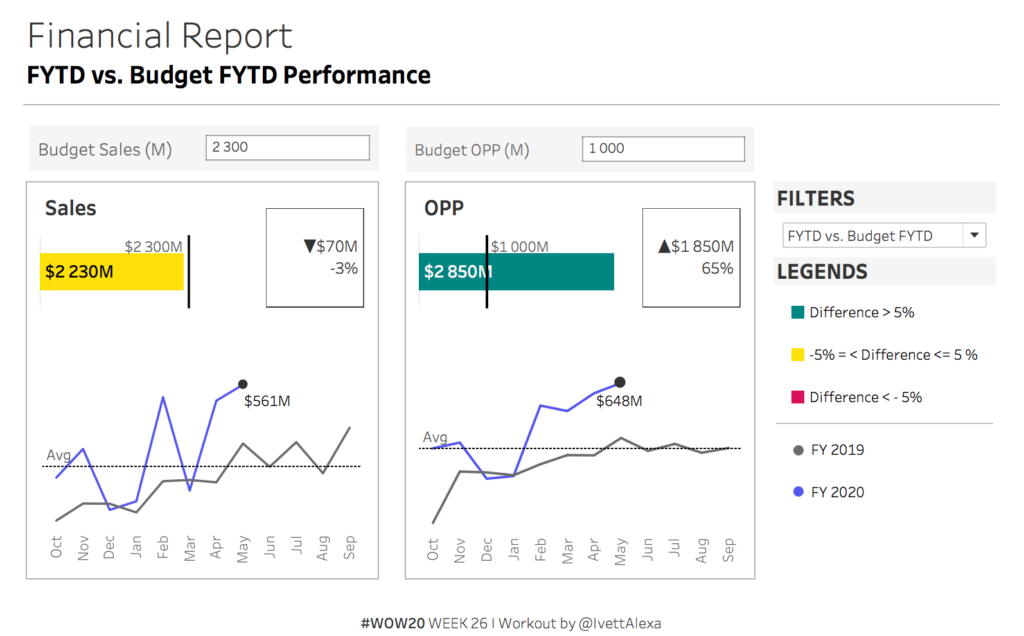
2020 Week 26: How does the company perform in the fiscal year?

Introduction Calendar years run from January 1st until December 31st, but an organization’s fiscal year might start in a different month. In this week’s challenge, a company’s fiscal year runs from October 1st through September 31st. Let’s see how this company performs. Configure your workbook as follows:  Click to open in Tableau Public Requirements Dashboard …

2020 Week 26: How does the company perform in the fiscal year? Read More

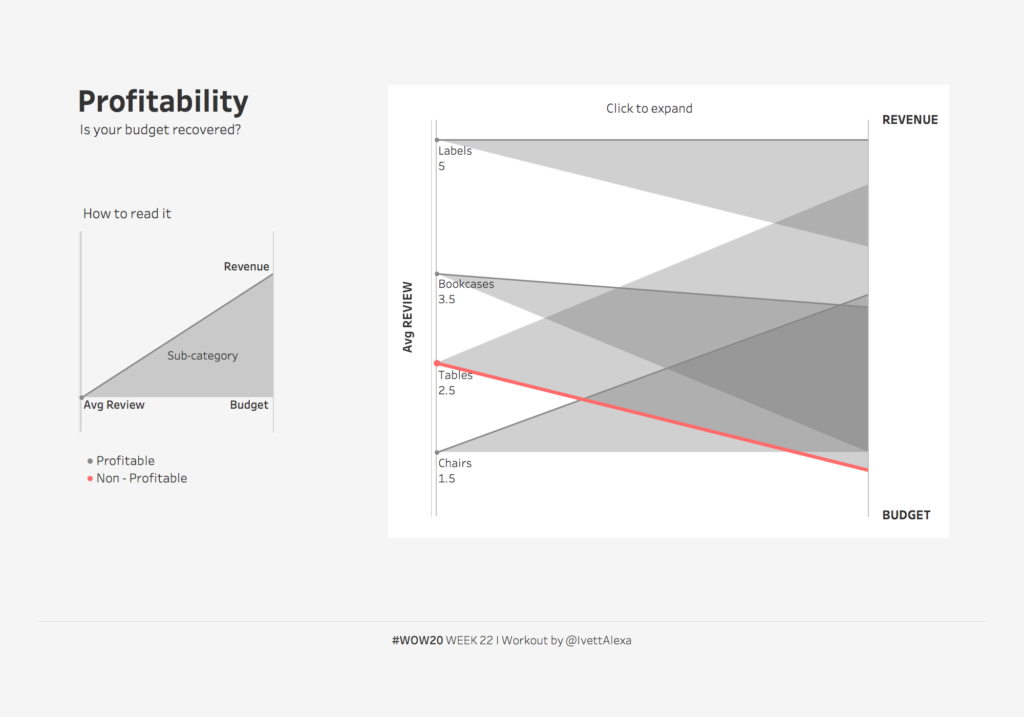
2020 Week 22: Profitability spotlight – is your budget recovered?

Introduction This week’s goal is to create a bi-dimensional chart (alternative parallel chart) that reveals if your budget has recovered or not. Parallel Coordinates represent multi-dimensional data across a set of vertical axis- different measures have different scales -, for this week’s challenge you will have to figure out how to show 2 different measures …

2020 Week 22: Profitability spotlight – is your budget recovered? Read More

Scroll to Top