2022 Week 07 | Power BI: Parallel Sets
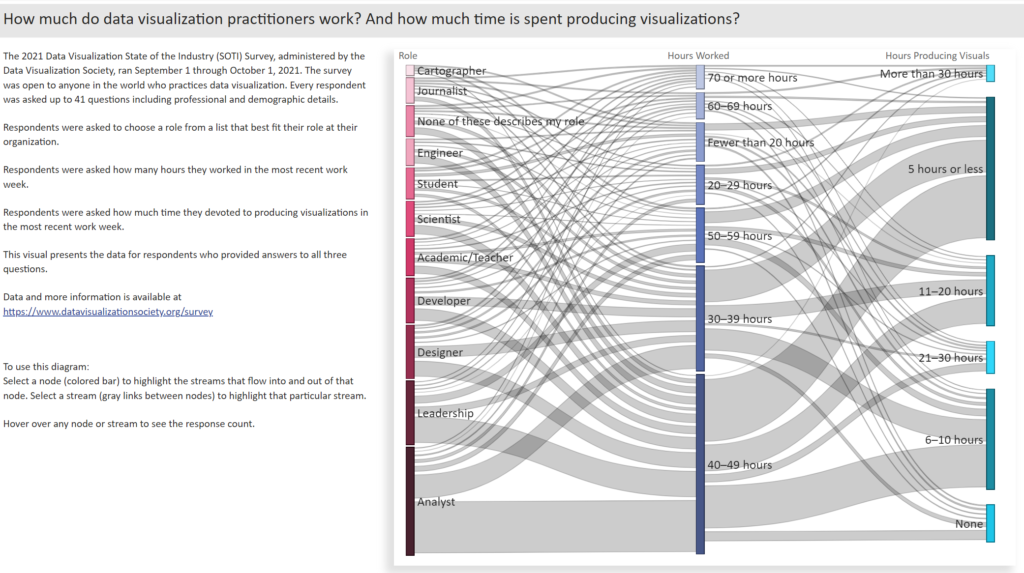
Introduction Welcome to week 7 of Workout Wednesday for Power BI 2022. We are again using the Data Visualization Society‘s annual State of the Industry survey results. This week we are looking at how we can visualize parallel sets. Although this may not be a visual that we use often, it can be very useful for multivariate analysis. …
