Rob Saunders

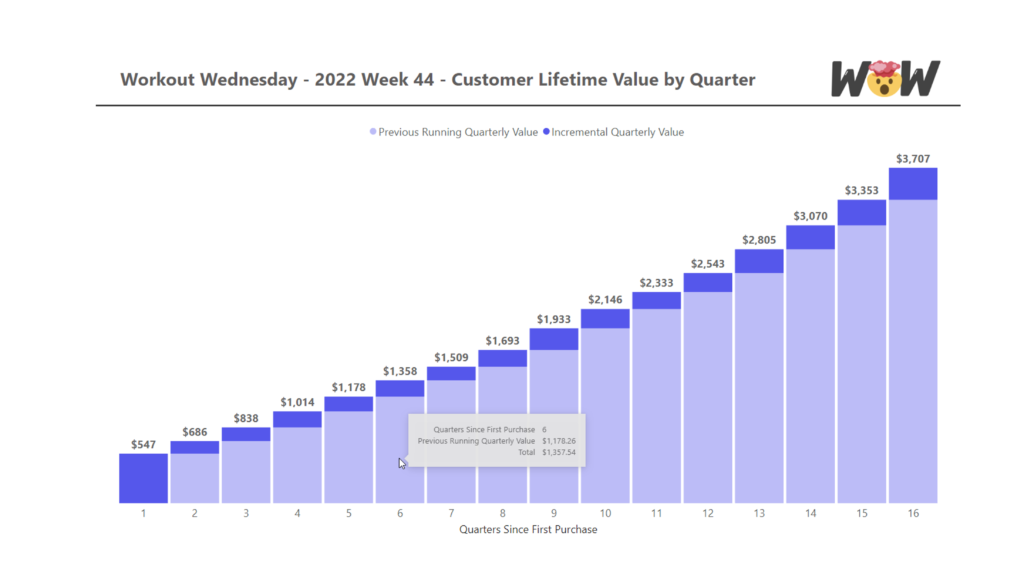
2022 Week 44 | Power BI: Customer Lifetime Value

Introduction This week, our challenge is to calculate customer lifetime value by quarter using DAX.  This is an advanced challenge so buckle up! As I was working on my challenge for week 44, I stumbled upon the drafted challenge for Tableau on the same week.  The Tableau challenge was… you guessed it… developing a chart …

2022 Week 44 | Power BI: Customer Lifetime Value Read More

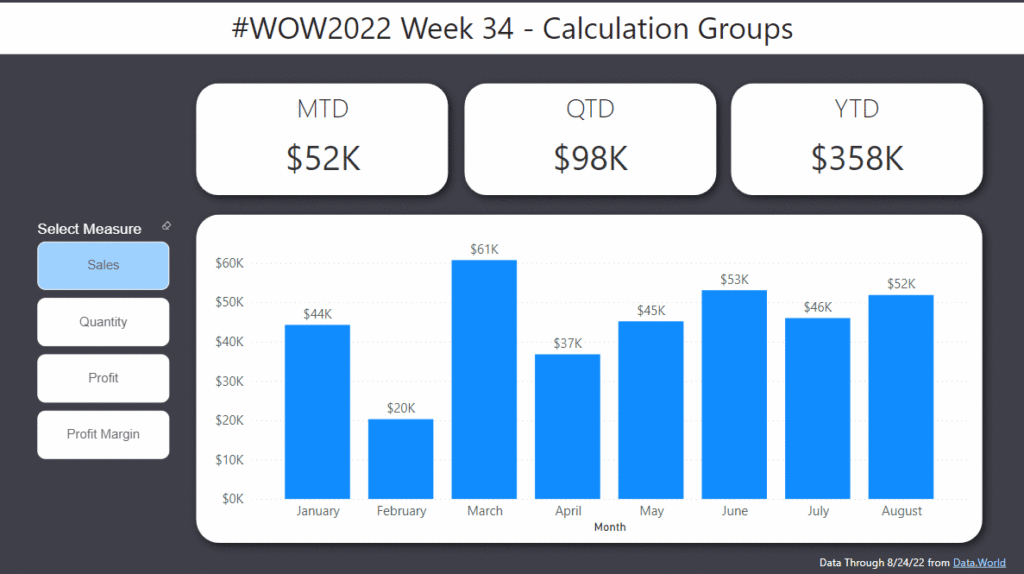
2022 Week 34 | Power BI: Calculation Groups

Introduction Calculation Groups in Power BI essentially allow you to apply logic or formatting to a variety of measures at the same time.  For example, let’s say you were looking to create a Month-To-Date, Quarter-To-Date, and Year-To-Date view across Revenue, Orders, and Units.  This would require you to create a calculation for each of the …

2022 Week 34 | Power BI: Calculation Groups Read More

2022 Week 25 | Power BI: Visualizing Music

Introduction June is still music month, so for this week’s challenge we’re going to visualize music. Sometimes the simple visualizations tell the best stories. That is definitely the case for the “warming stripes” visualization which was used to show the change of global temperature over time. Using this as motivation, what if we created a …

2022 Week 25 | Power BI: Visualizing Music Read More

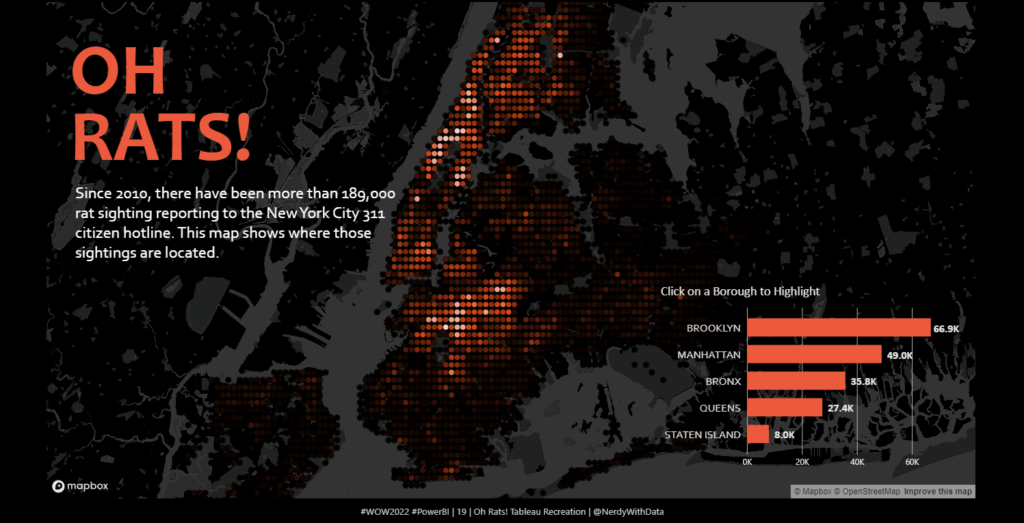
2022 Week 19 | Power BI: Oh Rats! Tableau Recreation

Introduction A few week’s ago, Sean Miller created an incredibly slick dashboard showing Rat Sightings in New York since 2010 for week 16 of Tableau’s Workout Wednesday (Challenge Link).  The challenge used Hexbins to combine multiple map points into shapes of the same size to show density more clearly within a map.  This week, we’re …

2022 Week 19 | Power BI: Oh Rats! Tableau Recreation Read More

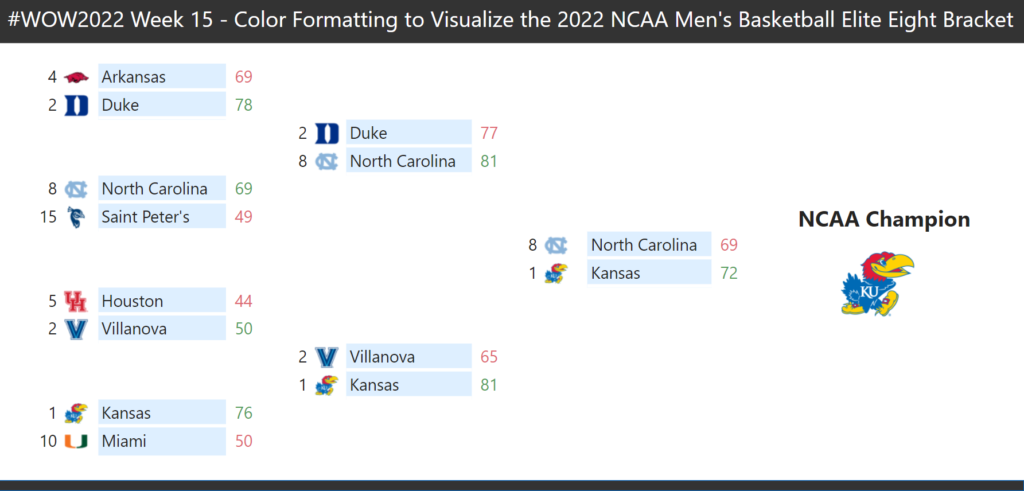
2022 Week 15 | Power BI: March Madness

Introduction For basketball fans in the United States, March is a special time.  It is when 64 of the best college basketball teams match up in a single elimination tournament to see who is the NCAA Men’s Basketball champion.  The early rounds of the tournament provide long days of basketball games across several TV stations.  …

2022 Week 15 | Power BI: March Madness Read More

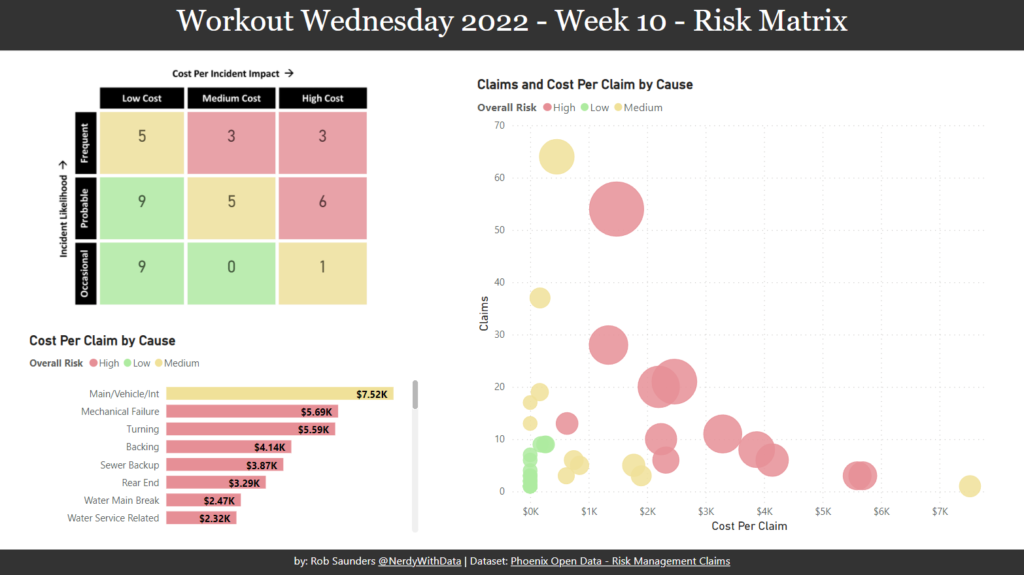
2022 Week 10 | Power BI: Risk Matrix

Introduction Your challenge this week is to create a Risk Matrix with some supporting visuals.  We decided to keep the project management theme going this week.  If you did not do last week’s challenge, I highly recommend you checkout Kerry’s Gantt Chart challenge, here.   For this challenge, I looked at a lot of possible ways to create a …

2022 Week 10 | Power BI: Risk Matrix Read More

Scroll to Top