
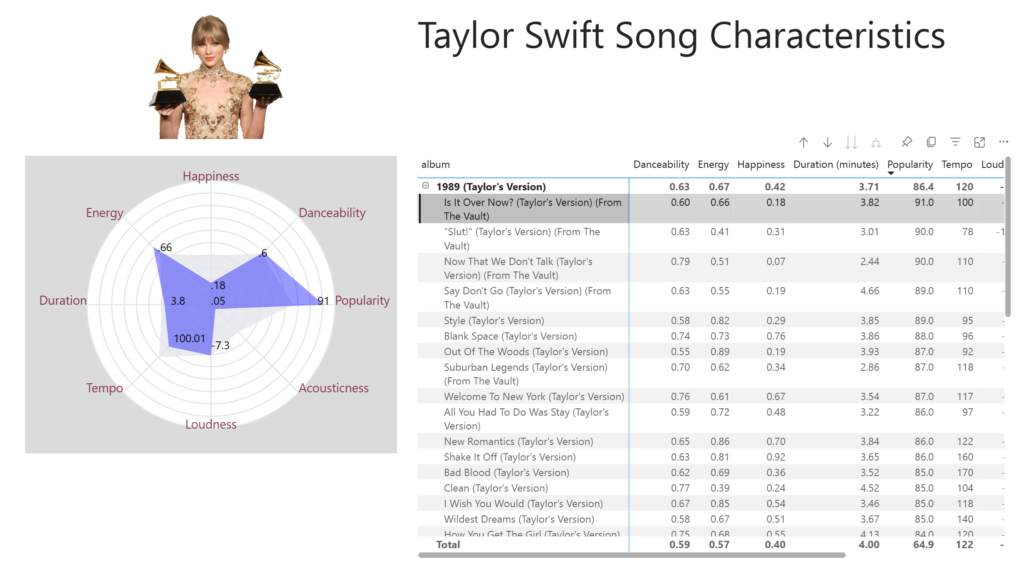
2023 Week 49 | Power BI: SVG Radar Chart
Introduction Radar charts have their pros and cons, but they are a great way to learn how to make a chart with an SVG image. Another reason to do this in SVG rather than with a custom visual is that it allows us to simulate small multiples by putting the measure in a table or …