Sigma

2025 Week 19 | Sigma: Can You Get Your Stat Sheet?

Introduction Aside from Battlebots Championships, NHL Stanley Cup Playoffs are my favorite sporting event of the year. And I think the logos are all so beautiful that they should be front and center when building out interactive data applications in Sigma. I always take opportunities like this to show off the ability of Sigma to …

2025 Week 19 | Sigma: Can You Get Your Stat Sheet? Read More

2025 Week 18 | Sigma: Can You Re-imagine This Map?

Can you re-imagine this influential map? Introduction In 1854, Dr. John Snow mapped cholera deaths in London to investigate how the disease was spreading. At the time, most believed cholera came from “bad air.” Snow used mapping to reveal a strong cluster of deaths around a single water pump on Broad Street, proving that contaminated …

2025 Week 18 | Sigma: Can You Re-imagine This Map? Read More

2025 Week 17 | Sigma : Can you create these bars?

Introduction In case you missed it, some of the Workout Wednesday authors competed for the first ever Golden Goat award as part of Sigma’s Data App Conference.  Which was super fun! You can check out the recording here: Appathon 2025 And you can check out my build demo here So, for this week’s challenge, let’s …

2025 Week 17 | Sigma : Can you create these bars? Read More

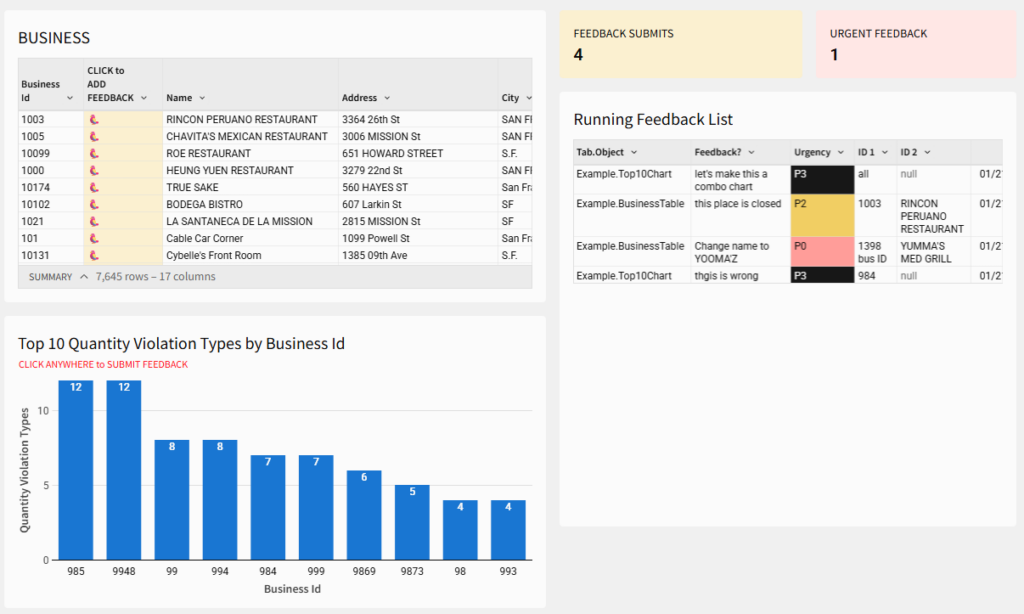
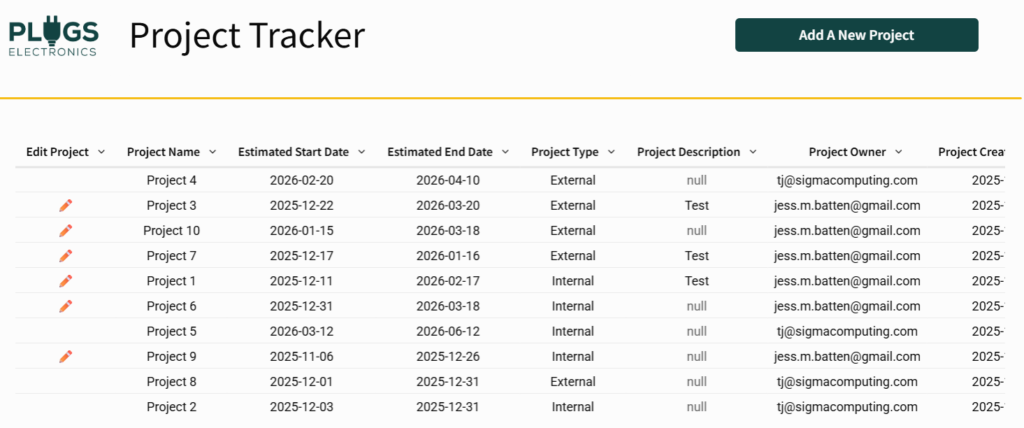
Interactive user interface and a table

2025 Week 15 | Sigma: Can You Override Elegantly?

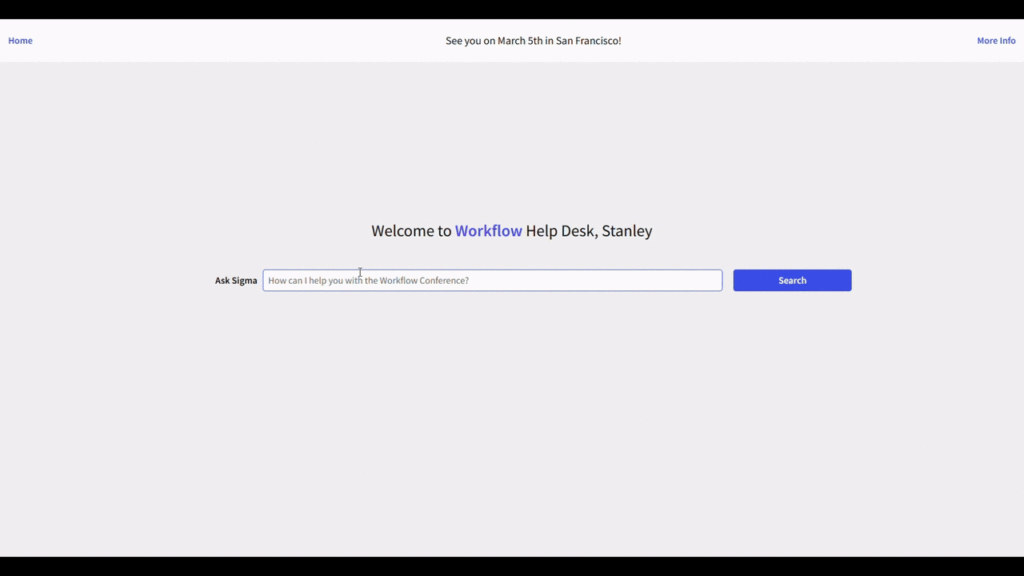
Introduction Welcome to week 11! This week, Sigma’s hosting it’s Data Apps Conference which will feature a ton of valuable information coming straight from Sigma’s team and community experts. The conference is Thursday, March 13, 2025 9:30am PT / 12:30pm ET Even on conference week, Sigma is still pushing out excellent new features. Our challenge …

2025 Week 15 | Sigma: Can You Override Elegantly? Read More

2025 Week 14 | Sigma: Can you Create a Small Multiples chart?

Can you make a small multiples chart? Introduction Edward Tufte, often called the godfather of data visualization, brought a minimalist, no-nonsense approach to presenting information. In his seminal 1983 book The Visual Display of Quantitative Information, he introduced a now-iconic concept: small multiples — a simple but powerful way to show data through repetition and …

2025 Week 14 | Sigma: Can you Create a Small Multiples chart? Read More

2025 Week 13 | Sigma : Can you track the winning streak?

Introduction For this week, we’re exploring row order dependant calculations. In this scenario, we’re trying to understand how our hometown baseball team’s winning streak impacts attendance. Are folks more likely to attend if the team keeps winning? Let’s find out!   Have Fun!Katrina Need access to Sigma? Click Here to Sign Up Link to WOW Sigma …

2025 Week 13 | Sigma : Can you track the winning streak? Read More

2025 Week 11 | Sigma: Can you use a legend?

Introduction Welcome to week 11! This week, Sigma’s hosting it’s Data Apps Conference which will feature a ton of valuable information coming straight from Sigma’s team and community experts. The conference is Thursday, March 13, 2025 9:30am PT / 12:30pm ET Even on conference week, Sigma is still pushing out excellent new features. Our challenge …

2025 Week 11 | Sigma: Can you use a legend? Read More

Scroll to Top