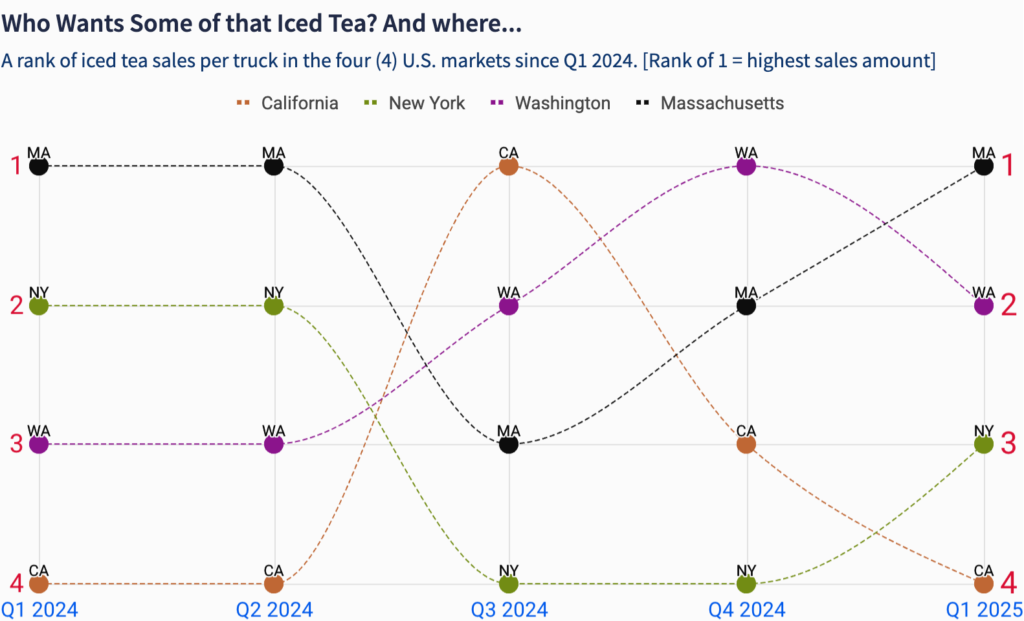
2025 Week 8 | Sigma : Can you Create a Bump chart?
Can you make a bump chart? Introduction Bump charts are a great way explore changes in rank over time. They’re also a snazzy way to gamify your data and create some friendly competition. A bump chart is more interactive with a continuous time field – the chart changes when a new date part occurs. We’ll …
2025 Week 8 | Sigma : Can you Create a Bump chart? Read More


