Month: February 2017

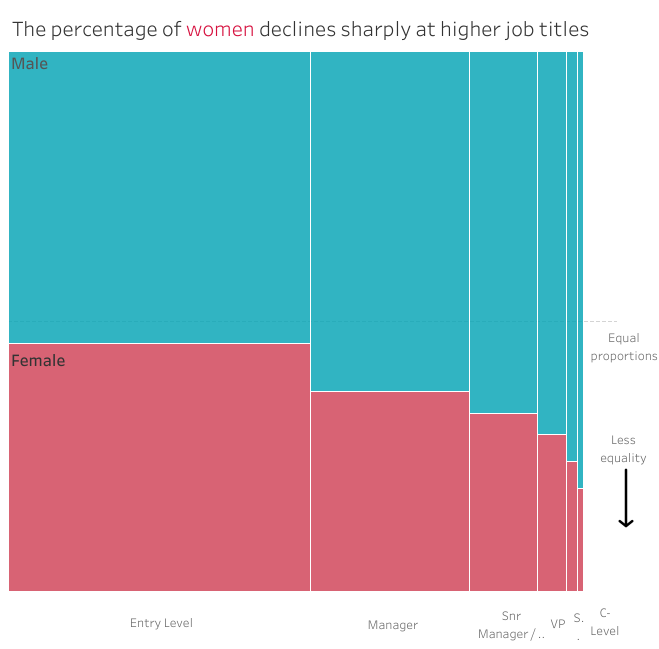
#WOW2017 | 08 | Marimekko Makeover

Introduction EDITOR’S NOTE: This challenge was originally published on Emma Whyte’s Tableau blog which no longer exists. This challenge is republished here with the author’s permissions This week I decided to re-create a makeover from Junk Charts in Tableau. This image originally appeared in The Wall Street Journal and shows the percentage of men and women employed …

#WOW2017 | 08 | Marimekko Makeover Read More

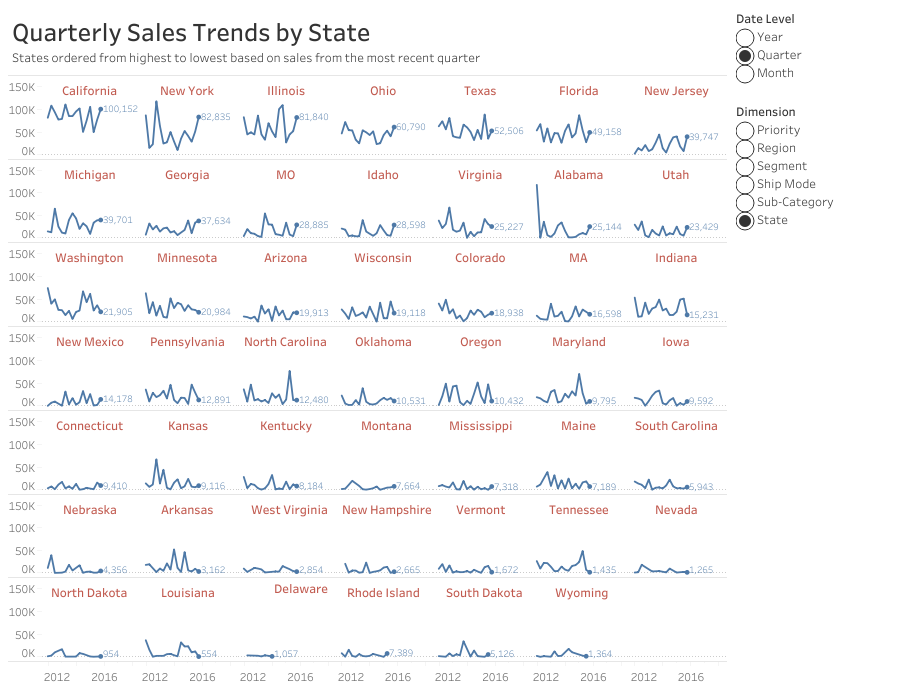
#WOW2017 | 07 | Dynamic Trellis Chart

Introduction This challenge is hosted on Andy’s website – check it out here  Click to open in Tableau Public Attribute When you publish your solution on Tableau Public make sure to take the time and include a link to the original inspiration.  Also include the hashtag #WOW2017 in your description to make it searchable! Share After …

#WOW2017 | 07 | Dynamic Trellis Chart Read More

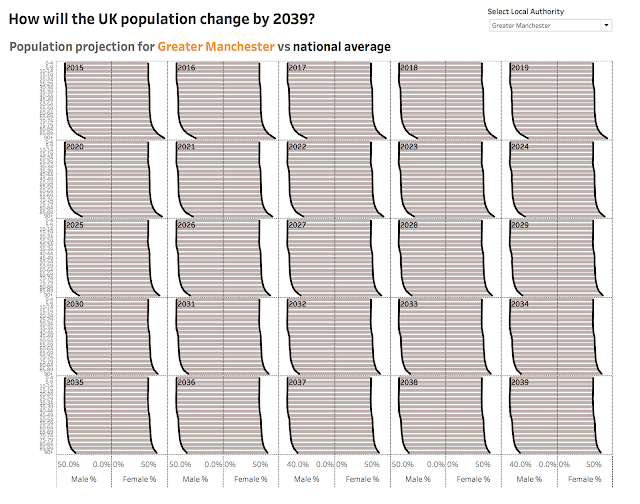
#WOW2017 | 06 | UK Population Predictions

Introduction EDITOR’S NOTE: This challenge was originally published on Emma Whyte’s Tableau blog which no longer exists. This challenge is republished here with the author’s permissions   This week I’m looking at creating population ‘butterflies’ in Tableau. As an extra challenge I’ve also created them in a trellis chart format! I’m a big fan of …

#WOW2017 | 06 | UK Population Predictions Read More

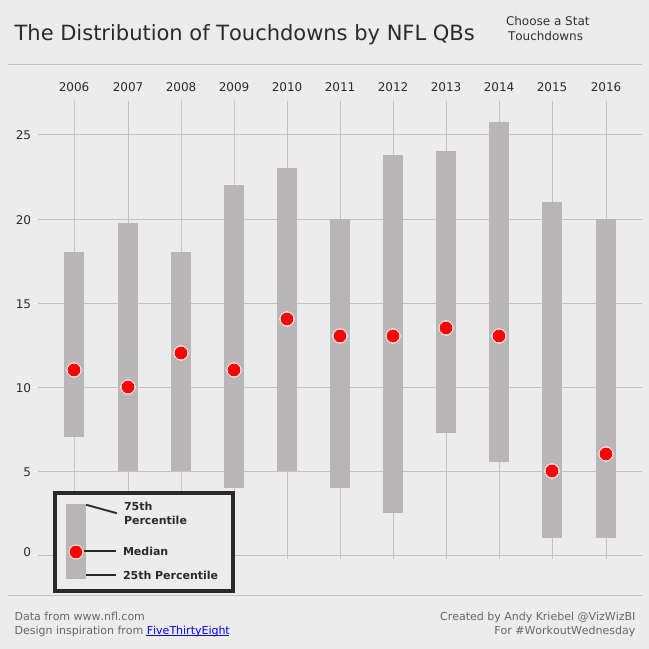
#WOW2017 | 05 | Distributions and Medians

Introduction This challenge is hosted on Andy’s website – check it out here  Click to open in Tableau Public Attribute When you publish your solution on Tableau Public make sure to take the time and include a link to the original inspiration.  Also include the hashtag #WOW2017 in your description to make it searchable! Share After …

#WOW2017 | 05 | Distributions and Medians Read More

Scroll to Top