Introduction
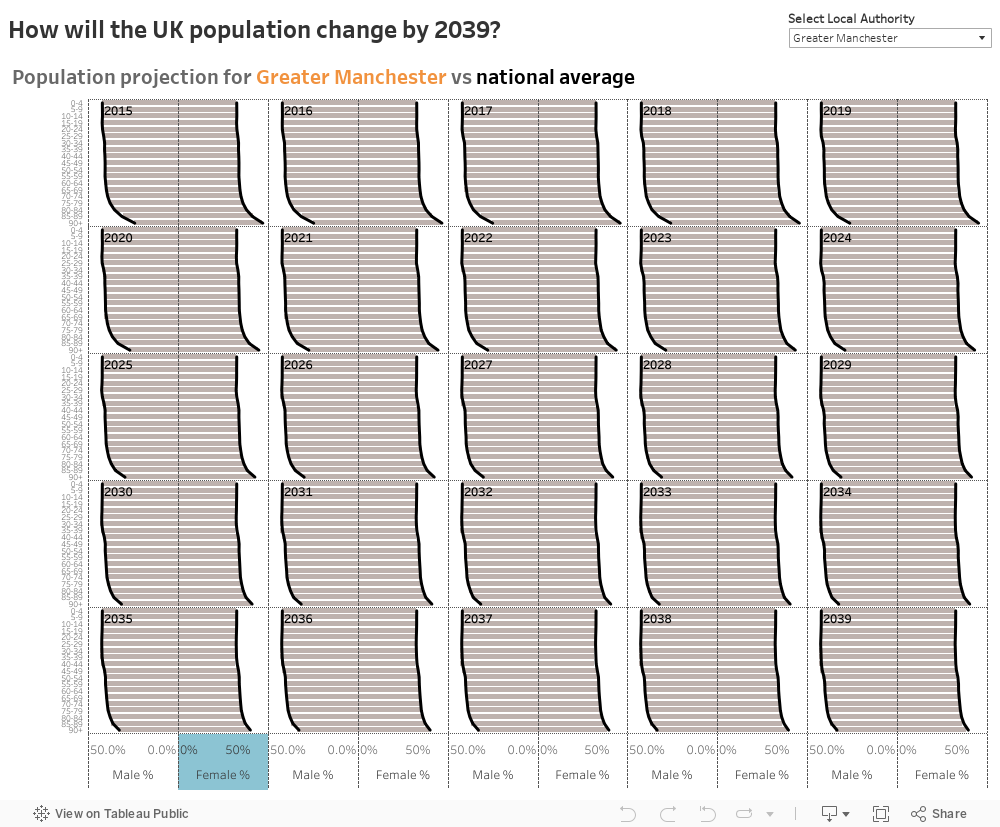
This week I’m looking at creating population ‘butterflies’ in Tableau. As an extra challenge I’ve also created them in a trellis chart format! I’m a big fan of trellis charts as they allow you to compare a vast amount of data in one page.
Each part of the trellis is a year, from 2015-2039. Each side of the butterfly is either the percentage of males or females by age group. The black line is the national average, the bars are the percentage for the local authority you have selected.
The aim of this chart was to give the user an indication of whether the percentage of males or females in their local area was on par with the national average; how this changes over time; and if there were any age groups that were either more female or male. What really struck me was in some areas how women are going to vastly outlive men!
Requirements
Some rules for re-creating this viz:
- I’ve filtered the original data to remove the year 2014 (to create an even trellis)
- I’ve filtered the original data to remove the local authority ‘England’ and the age group ‘all ages’ (these are unnecessary total lines in the data)
- You’ll need to create calculations to pull out male and female population numbers, then make them percentages
- You’ll need to create calculations to find out the national average for males and females
- Be able to filter to one local authority at a time (not select all – this makes for a messy & slow viz!)
- Display a label on each trellis part for the year
- The sheet title should change depending on the local authority you select
- My dashboard size is 1000×800 pixels
- My font is Tableau Bold for the titles and then Tableau Book for all other text
- Format the chart lines to be dashes and get them to look the same as mine
Dataset
Attribute
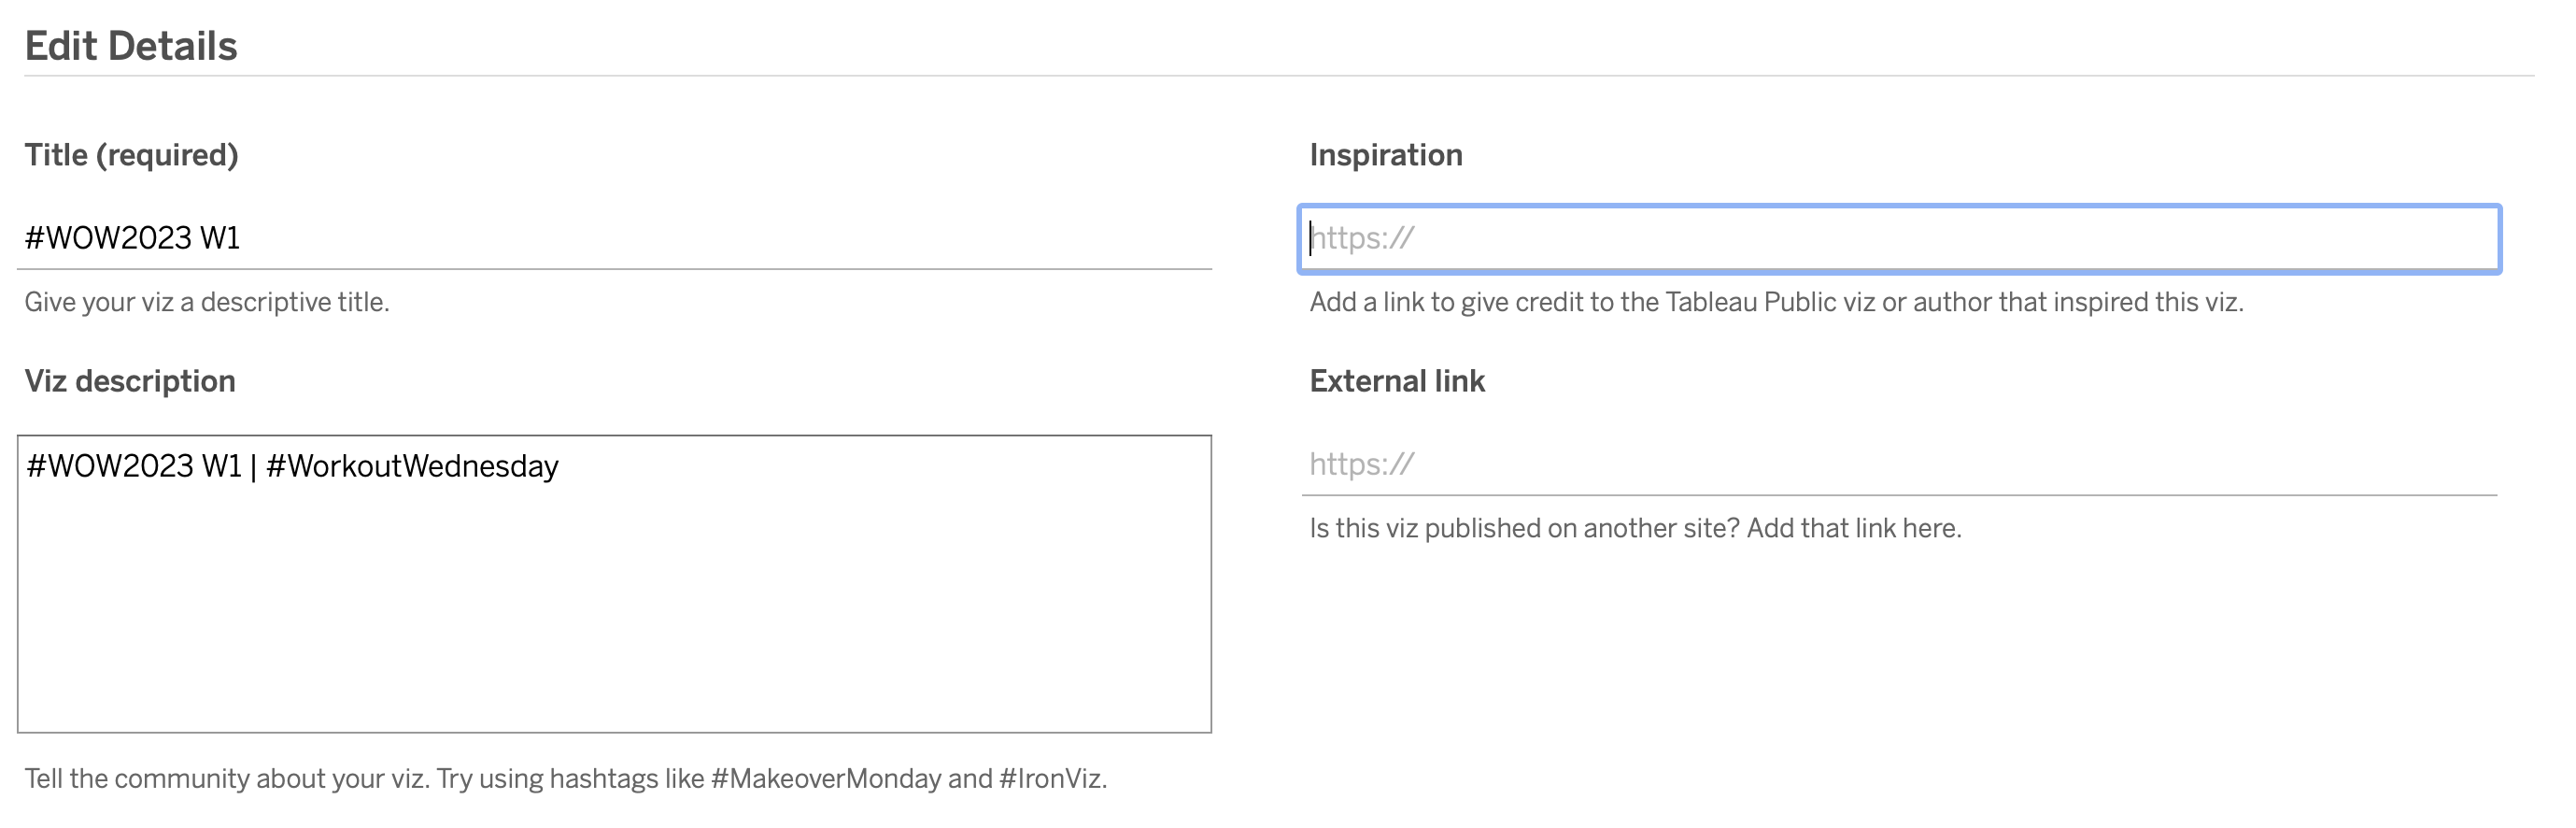
When you publish your solution on Tableau Public make sure to take the time and include a link to the original inspiration. Also include the hashtag #WOW2023 in your description to make it searchable!
Share
After you finish your workout, share on Twitter and/or LinkedIn using the hashtag #WOW2023 @Tableau and tag @WorkoutWednsday @EmmaWhyte & @vizwizbi
Solution
Interactive