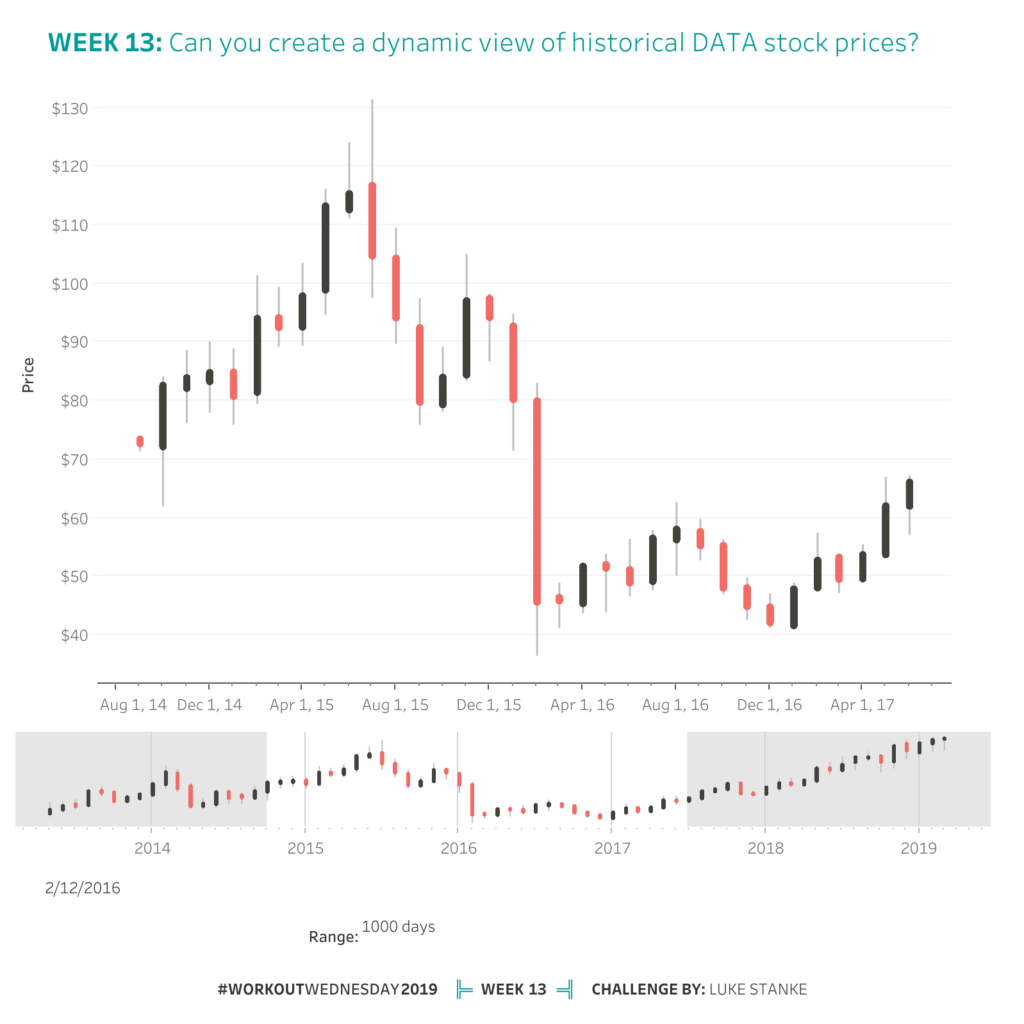
2019 Week 13: Can you create a dynamic view of historical DATA prices?
This week were taking a look at Tableau Stock prices using candlestick charts. So whats different about this? The dates aggregate at differet levels depending on the number of candlesticks! This challenge is not easy so there are 2 achievement levels. You can make this chart using either a gantt chart or by unioning the …
2019 Week 13: Can you create a dynamic view of historical DATA prices? Read More