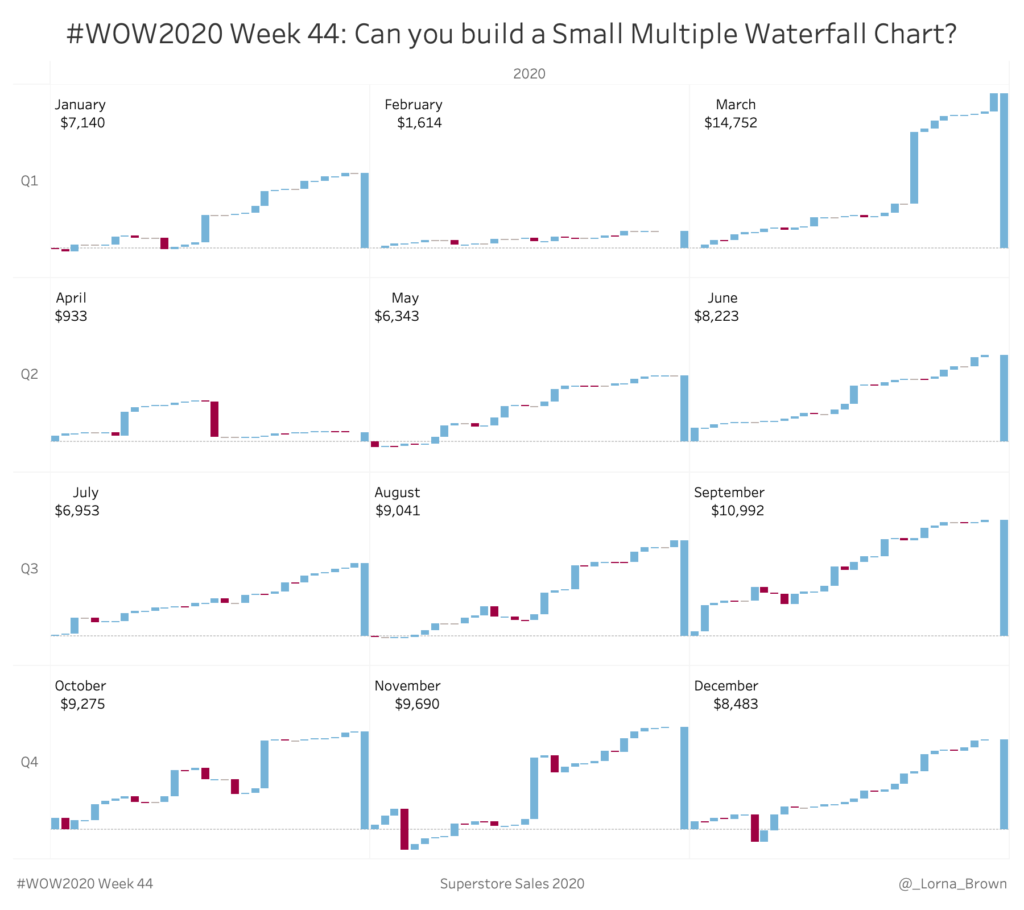
Year: 2020

2020 Week 43: Mobile Dashboard Challenge

Introduction This week’s challenge is two parts: Mobile dashboard design and KPI design. First, designing for mobile is difficult, but mobile is all about simplicity and interactivity. In this case, the KPIs also act as buttons that will reveal bar charts showing performance by month. To me this design is    Click to open in Tableau …

2020 Week 43: Mobile Dashboard Challenge Read More

2020 Week 42: Can you build a Strava Workout Calendar?

Introduction When Lorna asked me to be a Community contributor for Workout Wednesday, honestly, I was hesitant since I don’t participate every week. I typically only take on the challenges that I think are most beneficial to me as a teacher. I want to share work that I know the Data Schoolers are likely to …

2020 Week 42: Can you build a Strava Workout Calendar? Read More

2020 Week 40: #SportsVizSunday and Pro Football Focus

Introduction Hey everyone! I know, this isn’t your monthly #SportsVizSunday data challenge or the weekly thread of awesome sports vizzes, this is #WorkoutWednesday, but with a sports twist. My name is Spencer Baucke, co-founder of #SportsVizSunday and consultant at Tessellation. I was suuuuper excited when the #WoW crew reached out and asked if we wanted …

2020 Week 40: #SportsVizSunday and Pro Football Focus Read More

2020 Week 39: Can you build a mobile calendar picker?

Introduction Natalia Miteva is responsible for this week’s Community Workout Wednesday Challenge.  Here are all the details in Natalia’s own words: Very excited to share my challenge as part of the Workout Wednesday community contribution month! This week’s workout is inspired by Ludovic Tavernier‘s Date Range Picker viz. The aim of our challenge will be …

2020 Week 39: Can you build a mobile calendar picker? Read More

2020 Week 38: Can you Visualize Daily and Weekly Ticket Sales in the Same View?

Introduction Jami Delagrange is responsible for this week’s Community Workout Wednesday Challenge.  Here are all the details in Jami’s own words: A few months ago, I was working with conference registration data and the event team asked the question, “can we look at daily and weekly registrations in the same view?” The chart below is …

2020 Week 38: Can you Visualize Daily and Weekly Ticket Sales in the Same View? Read More

WOW2020 | week 36 | Can you find all counties within n miles of a selected county?

Introduction When I was asked to create a dashboard to help public health offices get a handle on the COVID-19 one of the more interesting challenges I was faced with how to allow the user to search for a particular county and filtering a map to only counties within a specified radius. So that’s what …

WOW2020 | week 36 | Can you find all counties within n miles of a selected county? Read More

#WOW2020 week 35 | Can you build a bivariate map?

Introduction Hi friends! Well, it’s been a quarter since my last challenge so you know what that means, it means we’ve got a new version of Tableau to check out! A couple weeks ago, 2020.3 was released and with it came a whole host of new awesome features and functionality! As always, #WOW2020 is here …

#WOW2020 week 35 | Can you build a bivariate map? Read More

Scroll to Top