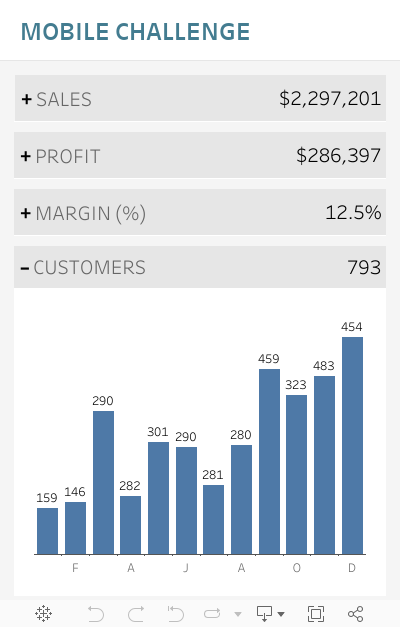
This week’s challenge is two parts: Mobile dashboard design and KPI design. First, designing for mobile is difficult, but mobile is all about simplicity and interactivity. In this case, the KPIs also act as buttons that will reveal bar charts showing performance by month.
Include KPIs for Total Sales, Total Profit, Profit Ratio, and Total Customers
Show the labels to the left and the values to the right.
When a KPI is selected show a “-” in front of the label
When a KPI is deselected show a “+” in front of the label
Marks should never highlight as selected
Match formatting
Bar charts
Only show a bar chart when selected
Show first letter for every-other month
Tick should be centered on the bars
Match Formatting
Match Actions
Dataset
The above example uses Sample – Superstore data from 2020.4. This week uses the superstore dataset for Tableau 2019.4. You can get it here at data.world
Attribute
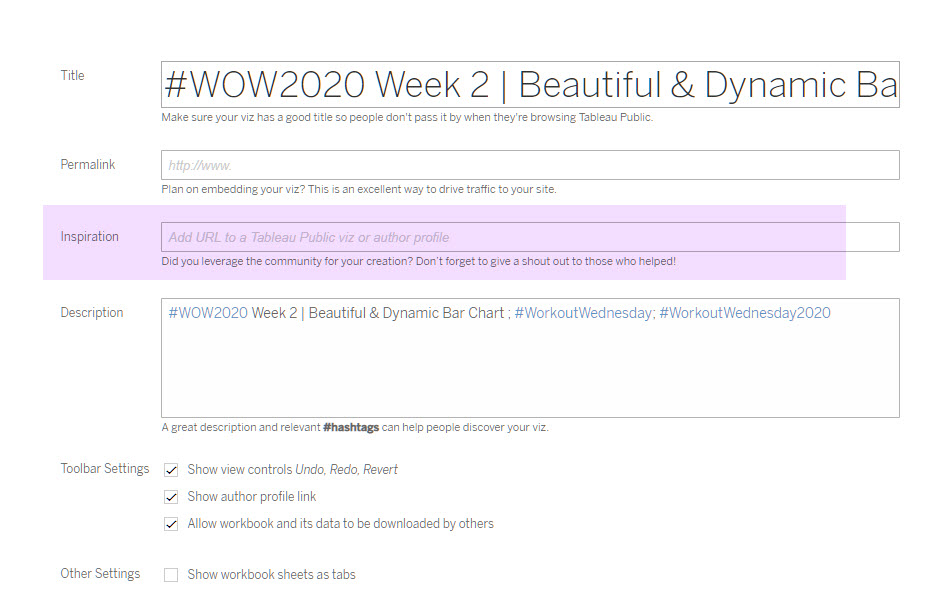
When you publish your solution on Tableau Public make sure to take the time and include a link to the original inspiration. Also include the hashtag #WOW2020 in your description to make it searchable!