2022 W16 | Power BI : Quadrant Plot with Jitter
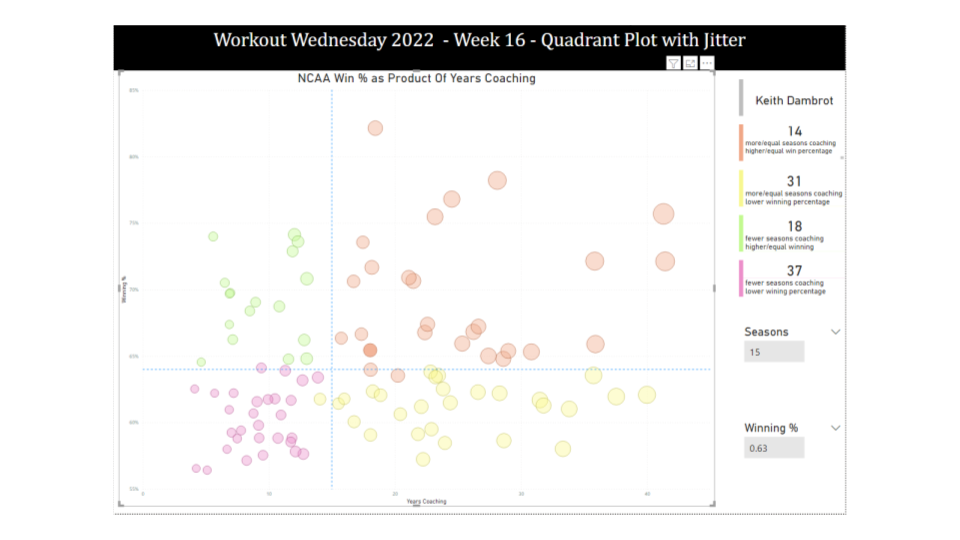
Introduction Your challenge this week is to create a Quadrant Plot. It should include different colors in each quadrant and the points should be jittered to try and reduce data overlap. Please note, that it is not expected to create the quadrants, quadrant lines, and color change by selecting any individual data point (if someone figures out how …


