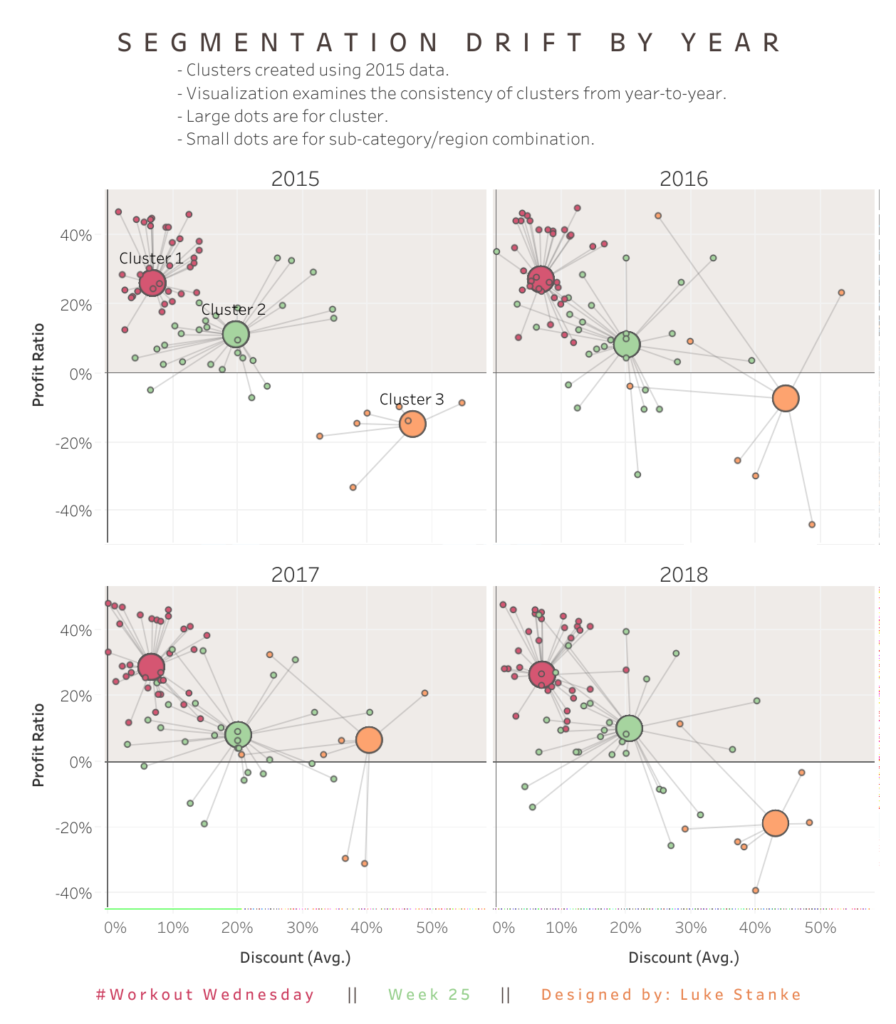
Luke Stanke

Week 21: Profit and Sales Cat Emoji Map

This week’s Workout Wednesday is an emoji map. The original idea comes from a Dark Sky emoji map of the weather. This worksheet has several major elements you’ll have to work through: Data modeling Percentiles Hex bins of geospatial data Working with emojis Customized “legend” Requirements Dashboard size: 600 x 600, 2 sheets (floating and …

Week 21: Profit and Sales Cat Emoji Map Read More

Week 18: Customer Retention By Cohort and Quarter

If you’ve ever worked with web Google Analytics then you’ve probably seen the cohort analysis chart. To me its the coolest information provided. This week were back with an intermediate and jedi options. Both look basically the same but the jedi forces your thinking to a higher level!   Intermediate Build a cohort analysis heat …

Week 18: Customer Retention By Cohort and Quarter Read More

Workout Wednesday – Week 16: Sales for the last N vs. same time previous year

Sorry for the late post. I’m filling in this week at the last minute. Here is this weeks workout.   click to view on Tableau Public Dashboard size is 700 x 600; tiled; 1 sheet Use a date parameter to select a select end date, limit it to all days in 2017. Use a parameter …

Workout Wednesday – Week 16: Sales for the last N vs. same time previous year Read More

Week 15: Total Products by Sub-Category OR Top 5 Sub-Categories by Total Product

I’m back from a one month hiatus! Hopefully you enjoyed the guest posts from Curtis Harris and Ann Jackson. This week were giving you two options: Intermediate or Jedi. Both are a play on an olympics visualization I put together a month ago. The Intermediate requires just a handful of calculations. The Jedi looks just …

Week 15: Total Products by Sub-Category OR Top 5 Sub-Categories by Total Product Read More

#WorkoutWednesday – Week 6: Regional Sales Across the Product Hierarchy

This week you will need to use your formatting skills and your knowledge with formatting color. You’ll also be using using the rarely-utilized hierarchy on this dashboard and you’ll need to utilize the “+” and “-” to drill in and out of the hierarchy. Below are images and check out the version on Tableau Public …

#WorkoutWednesday – Week 6: Regional Sales Across the Product Hierarchy Read More

#WorkoutWednesday 2018 – Week 5

This week Andy is back with a challenge and it’s very straightforward. You need to create two quarters starting with the month selected and show months for everything else. Requirements No Level-of-Detail calculations. No table calculations. The Q2 value must always appear after Q1. There are no spoilers this week. This week utilizes the Superstore …

#WorkoutWednesday 2018 – Week 5 Read More

Scroll to Top