
This week we take a look at chart that looks so simple: the number of births by year for any given name. There are few requirements that make this much more tricky. While the dataset is huge, I’d like you to show one name: whatever name you see in the parameter. When the parameter is empty or there is no data for a particular name be sure to show the name Rody. I’d highly suggest that you check 4-5 different names before you get started: Jose, JESSIE, angel, zzz, and Mai.
Requirements
- The dashboard size is 600px by 500px
- Place the sex with the smallest count on top of the sex with the larger count.
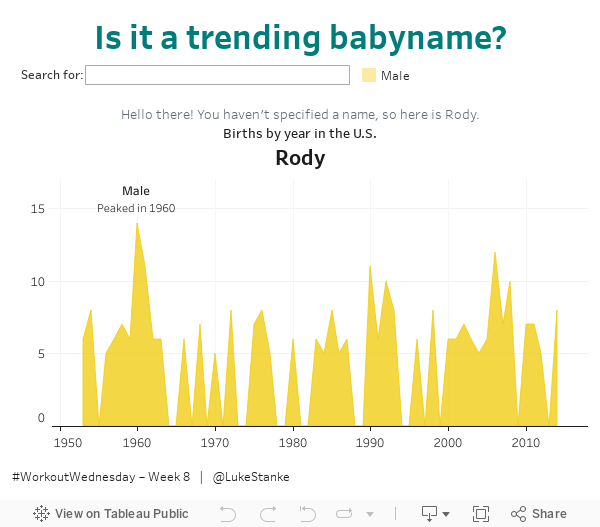
- Label the year with the maximum births for each gender. Make sure the label matches the visualization.
- Be sure these labels always show up above the maximum value points. (I’ll be keeping an eye out for this).
- Be sure the years with no values are equal to zero.
- Be sure that when the parameter is empty the name shown on the chart is Rody.
- Include the welcome message asking individuals to search for a name.
- If a name cannot be found let the end-user know and also show the name Rody. (Enter zzz in in the parameter to see what I am looking for)
- If the name is in the dataset, show information for the chart below.
- Use the Jewel Bright Color palette and set the color of male to yellow and female to light teal.
This week utilizes a baby names dataset showing birth names in United States from 1950 through 2015. Names with less than 5 in a year are omitted. You can get it here at Data.World
As you complete this example, feel free to share on Twitter using the #WorkoutWednesday hashtag. Don’t forget to tag @RodyZakovich, and @LukeStanke. We really want to see your work.
Also, if you want your efforts throughout 2018 tracked, feel free to fill out this Google Form.
Good luck!
Spoilers!
- If you are at a loss on where to start, start by filtering just to Rody and getting the Rody name chart to match.
- Convert Year to a date field. You’ll have to spend some time figuring out how to get the axis correct
- For the parameter, you’ll want to might want to covert the value to lowercase and compare it to a lowercase version of the [Name] field. This will be a very valuable field
- It may-or-may-not be very useful to write a level of detail calculation that returns the year where births were the largest by sex.
- You’ll probably want to unstack your marks on an area chart.
- Create a calculated field that multiples the count times a float parameter. Use that calculation to create a reference line to give your labels enough space. I set my parameter to 1.1.
date column not available in the database kindly help me, how to make it report without date column,
please reply
Hi Zubair, looking for a makedate or date function in Tableau, and you get the answer.
Hi, this is my effort of this week
https://public.tableau.com/profile/marcodegola#!/vizhome/WorkoutWednesday2018/2018w08-ww?publish=yes
SOO MUCH HARDER TO COME BY, THANK YOU SO MUCH
DISCOVERED
* that damn show missing values on year – dammit
Nice one – https://public.tableau.com/views/WorkoutWednesday2018-Week8-TrendingBabyNames/WOW2018-Week8?:language=en-US&:display_count=n&:origin=viz_share_link