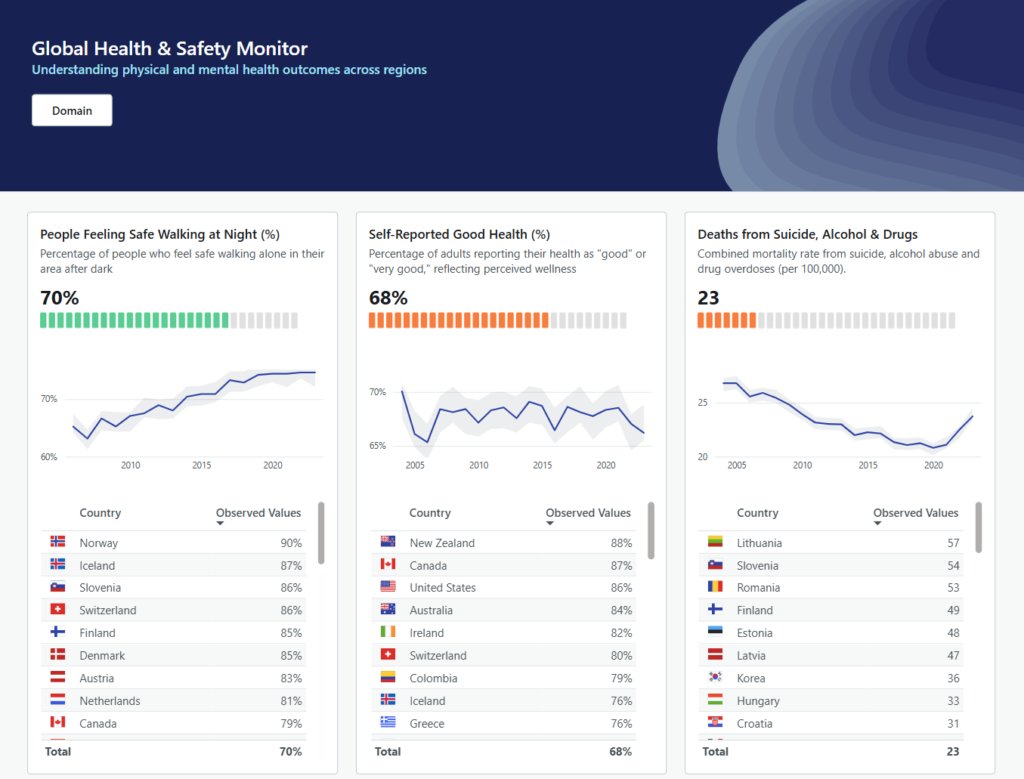
Shannon Lindsay

2024 Week 11 | Power BI: IBCS Charts with Injae

Introduction Welcome back to Workout Wednesday! This week we’re taking notes out of Injae Park’s portfolio and recreating one of his IBCS charts. IBCS, or the International Business Communication Standards is a set of rules to level up how businesses talk and share info. Think of it as a cheat code for clearer charts and …

2024 Week 11 | Power BI: IBCS Charts with Injae Read More

2024 Week 10 | Power BI: DAX-less Reporting!

Introduction Welcome back to Workout Wednesday! This week’s challenge is for folks who want to practice building reports that do have calculations but do not use complex DAX! I also had a little fun with Microsoft Designer for the images. If you haven’t had a chance to play around with this new AI design tool …

2024 Week 10 | Power BI: DAX-less Reporting! Read More

2024 Week 6 | Power BI: Customer Lifetime Value Matrix

Introduction Welcome back to Workout Wednesday! This week’s challenge is inspired by Ann Jackson, who created the challenge back in 2021 for the Tableau team. Let’s create a Customer Lifetime Value (CLV) Matrix, a tool that marketers use to segment customers based on their value and loyalty to a business. This helps marketers allocate resources …

2024 Week 6 | Power BI: Customer Lifetime Value Matrix Read More

2024 Week 3 | Power BI: Back to basics with a bar chart

Introduction Welcome back to Workout Wednesday! We’re taking it back to basics this week and creating a bar chart that uses small multiples and conditional formatting. We’re using the #MakeoverMonday team’s data on New Year’s Resolutions and the design is inspired by a Makeover Monday participant! A huge thank you to Ela Piwowarska for creating her submission and …

2024 Week 3 | Power BI: Back to basics with a bar chart Read More

2023 Week 50 | Power BI: Clippy’s Random Gift Generator

Introduction Happy holidays to everyone who celebrates! Join us this week to get some help shopping for your friends and family, using a dataset you provide and a random number generator in Power Query. If Clippy can’t pick a gift, no one can! Have fun and create the random gift generator in whatever way you …

2023 Week 50 | Power BI: Clippy’s Random Gift Generator Read More

2023 Week 45 | Power BI: Create a dumbbell chart with Deneb

Introduction Welcome back to Workout Wednesday! This week we’re creating a dumbbell chart to compare 2 sets of values using Deneb! If this is your first time using Deneb I highly recommend you play around with either the Vega or Vega-lite languages in the online editor, where you can load the code from examples, amend it, …

2023 Week 45 | Power BI: Create a dumbbell chart with Deneb Read More

2023 Week 42 | Power BI: Add value to tables with SVGs

Introduction Welcome back to Workout Wednesday! This week we’re adding value to tables using SVG images! I was inspired by Sean Miller’s Week 16 Tableau challenge, and thought we could re-create this in Power BI. In this challenge, you’ll use various techniques to enhance the presentation of data within your Power BI table visual. These techniques include utilizing …

2023 Week 42 | Power BI: Add value to tables with SVGs Read More

2023 Week 39 | Power BI: Bar chart custom labels

Introduction This week we’re revisiting Meagan’s challenge where we built a bar chart with long labels. We’re going to use a trick recently unveiled by Bas (@howtopowerbi on Twitter) to create custom labels for bar charts. If you have long labels in your bar chart, they may be truncated depending on the size of the …

2023 Week 39 | Power BI: Bar chart custom labels Read More

2023 Week 34 | Power BI: Use core visuals with dynamic titles

Introduction Welcome back to Workout Wednesday! This week we’re building some basic visuals and use dynamic titles to visualize gas prices in the Rocky Mountain Region of the US (where I live!) over the past 3 years from the U.S. Energy Information Administration. Be sure you’re using the June 2023 version of Power BI desktop or later …

2023 Week 34 | Power BI: Use core visuals with dynamic titles Read More

2023 Week 30 | Power BI: Build a smooth line chart

Introduction Welcome back to Workout Wednesday! This week we’re building a line chart using the new smoothing feature that was released this month! This week’s challenge was inspired by Andy Kreibel’s Makeover Monday challenge. We’re exploring the disappearing sea ice in the Antarctic using a line chart, looking at the extent of sea ice in millions of …

2023 Week 30 | Power BI: Build a smooth line chart Read More

Scroll to Top