Sigma

2024 Week 26 | Sigma: Can you calculate RunRates?

Introduction Welcome to Week 26! When we dive into monthly data, it’s often more helpful to predict the current month’s numbers rather than relying on incomplete data for an incomplete month. This week, we’re trying out three different ways to estimate sales projections for the ongoing month, also known as the run rate. Dealing with …

2024 Week 26 | Sigma: Can you calculate RunRates? Read More

2024 Week 25 | Sigma: Can you compare these populations?

Introduction Welcome to Week Twenty-Five! This week, you’re going to compare US Census data from 2000 and 2010.  In this challenge, we’ll highlight a couple of new formatting additions to Sigma, as well as create a dynamic parameter.  Good Luck!-Ashley Need access to Sigma? Click Here to Sign Up Link to WOW Sigma Instance Youtube …

2024 Week 25 | Sigma: Can you compare these populations? Read More

2024 Week 24 | Sigma: Can you add custom map layers?

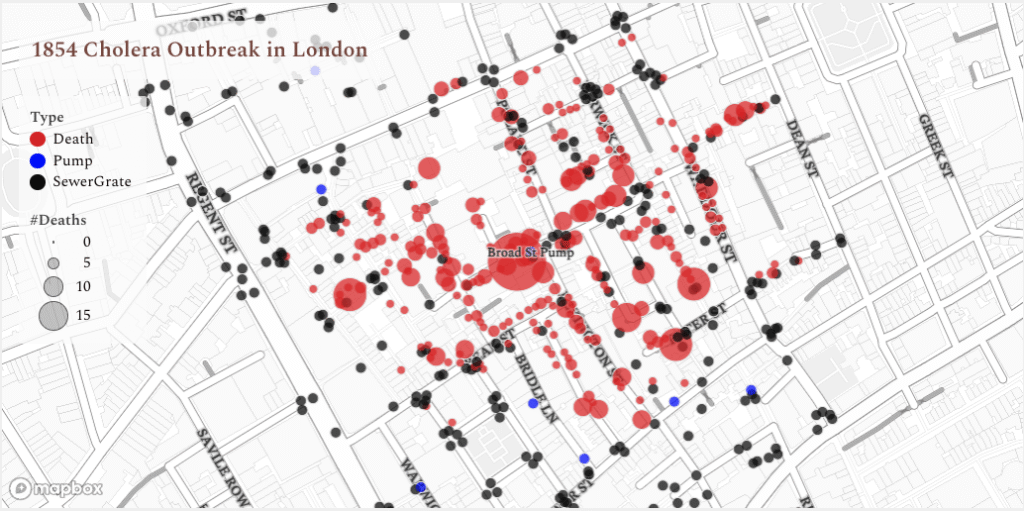
Introduction A few weeks ago, the 19th Police District of Chicago emailed me with some interesting survey data. The visualizations were useful, but they were living inside of a Google Slides presentation, and I wanted to dig deeper into the results. Thankfully, I followed my nose to their community survey website and found that they …

2024 Week 24 | Sigma: Can you add custom map layers? Read More

2024 Week 23 | Sigma: Can you fill the donut hole?

Introduction As workbook builders we need to be thoughtful when deciding which visualizations to use in all sorts of scenarios. A good rule of thumb to help decide is looking for visualizations that provide high amounts of information to a low pixel or space ratio.  This week we’re choosing to fill the donut chart to …

2024 Week 23 | Sigma: Can you fill the donut hole? Read More

2024 Week 21 | Sigma: Can you set some boundaries?

Introduction This week, I was inspired by a post in the Sigma Community from Mark Ruesink that showed a really clever way to visualize outliers in Sigma using a combo chart and some clever calculations. Mark goes all the way to visualizing outliers, so I definitely recommend checking out his full post, but I wanted …

2024 Week 21 | Sigma: Can you set some boundaries? Read More

2024 Week 20 | Sigma: Can you create quadrants?

Introduction Week 20 already! Crazy how fast the year is going by…and how fast you’re skilling up in Sigma! I love scatter plots. They’re a great way to display a lot of information in an easily consumable package. Layering quadrant colors on top, make it even easier to visually group dots and find outliers.  -Katrina …

2024 Week 20 | Sigma: Can you create quadrants? Read More

2024 Week 19 | Sigma: Can you clean a string?

Introduction After last week’s awesome product launch, I was thinking about some of the Sigma features that we have not yet highlighted in Workout Wednesday. One of those is Custom Functions, and while the ability to create Custom Functions is currently reserved for admins, it’s a great feature for users to be aware about when …

2024 Week 19 | Sigma: Can you clean a string? Read More

2024 Week 18 | Sigma: Can you consolidate data?

Introduction Welcome to Week 18! This week we’ll be consolidating menu item data and sales data from Sigma’s sample food trucks database using a powerful tool – Joins! We’ll use both Joins and Lookups to get a feel of the difference between the two. The formatting styles and colors in this challenge are all up …

2024 Week 18 | Sigma: Can you consolidate data? Read More

2024 Week 17 | Sigma: Can you Cohort These Customers?

Introduction Welcome to Week Seventeen! This week, you’re going to perform a Cohort Analysis of food truck customers based on when they placed their first order.  Conditional formatting will help highlight which cohorts have a greater percentage of customers in them. As a bonus, you will implement a dynamic page control input to let the …

2024 Week 17 | Sigma: Can you Cohort These Customers? Read More

Scroll to Top