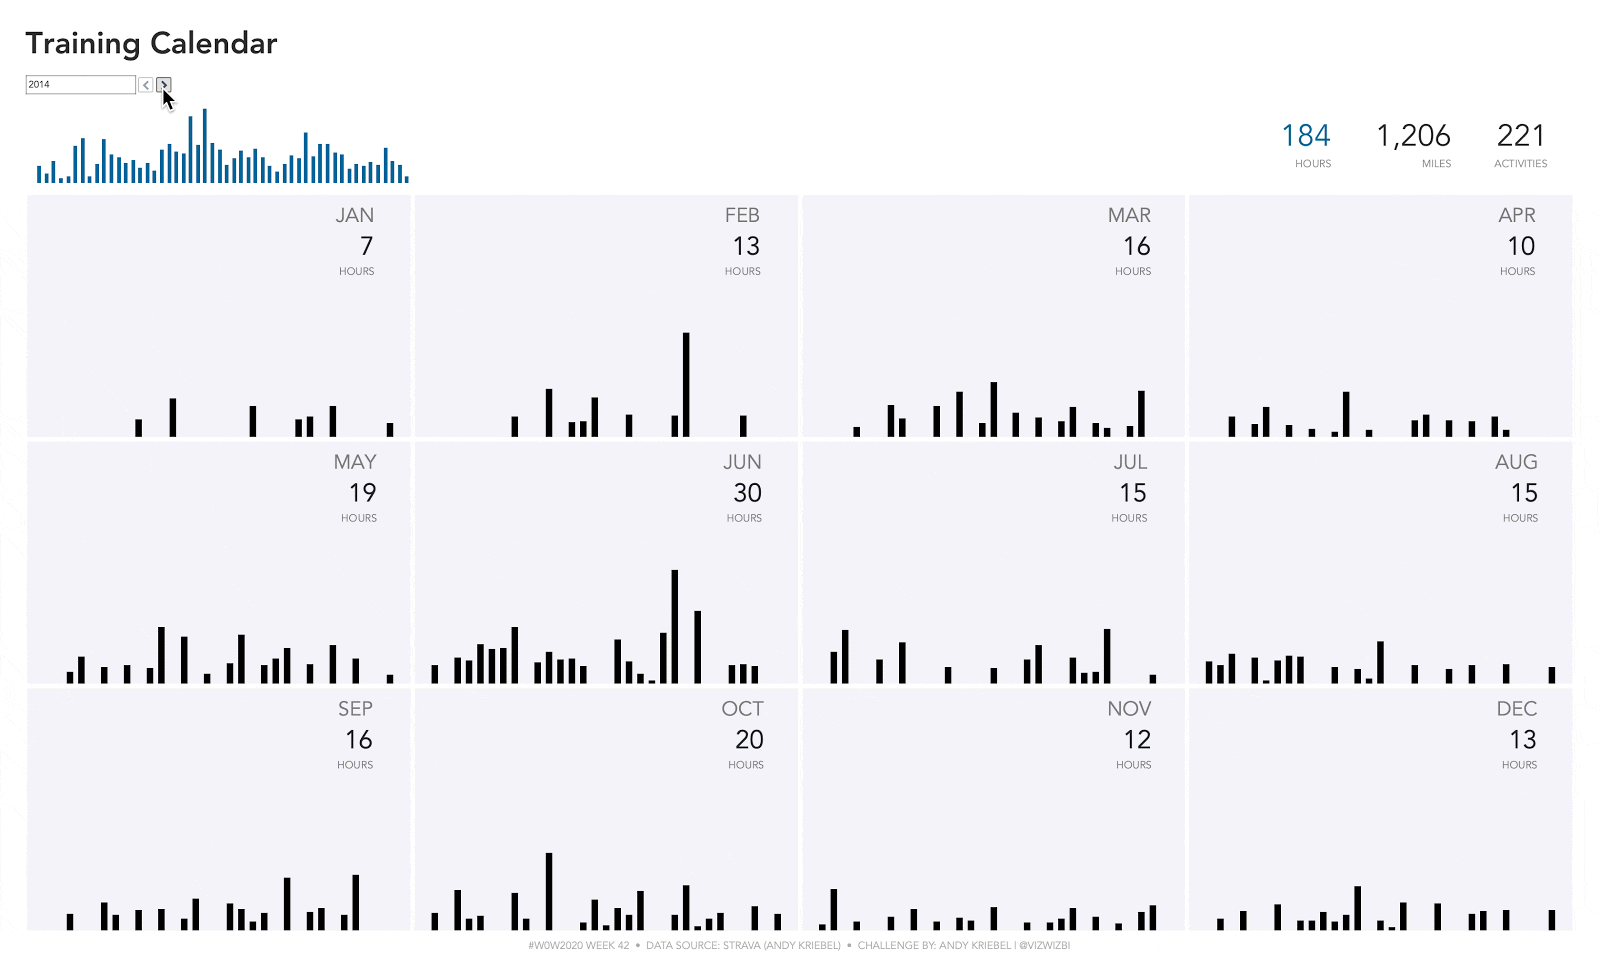
2020 Week 42: Can you build a Strava Workout Calendar?
Introduction When Lorna asked me to be a Community contributor for Workout Wednesday, honestly, I was hesitant since I don’t participate every week. I typically only take on the challenges that I think are most beneficial to me as a teacher. I want to share work that I know the Data Schoolers are likely to …
2020 Week 42: Can you build a Strava Workout Calendar? Read More