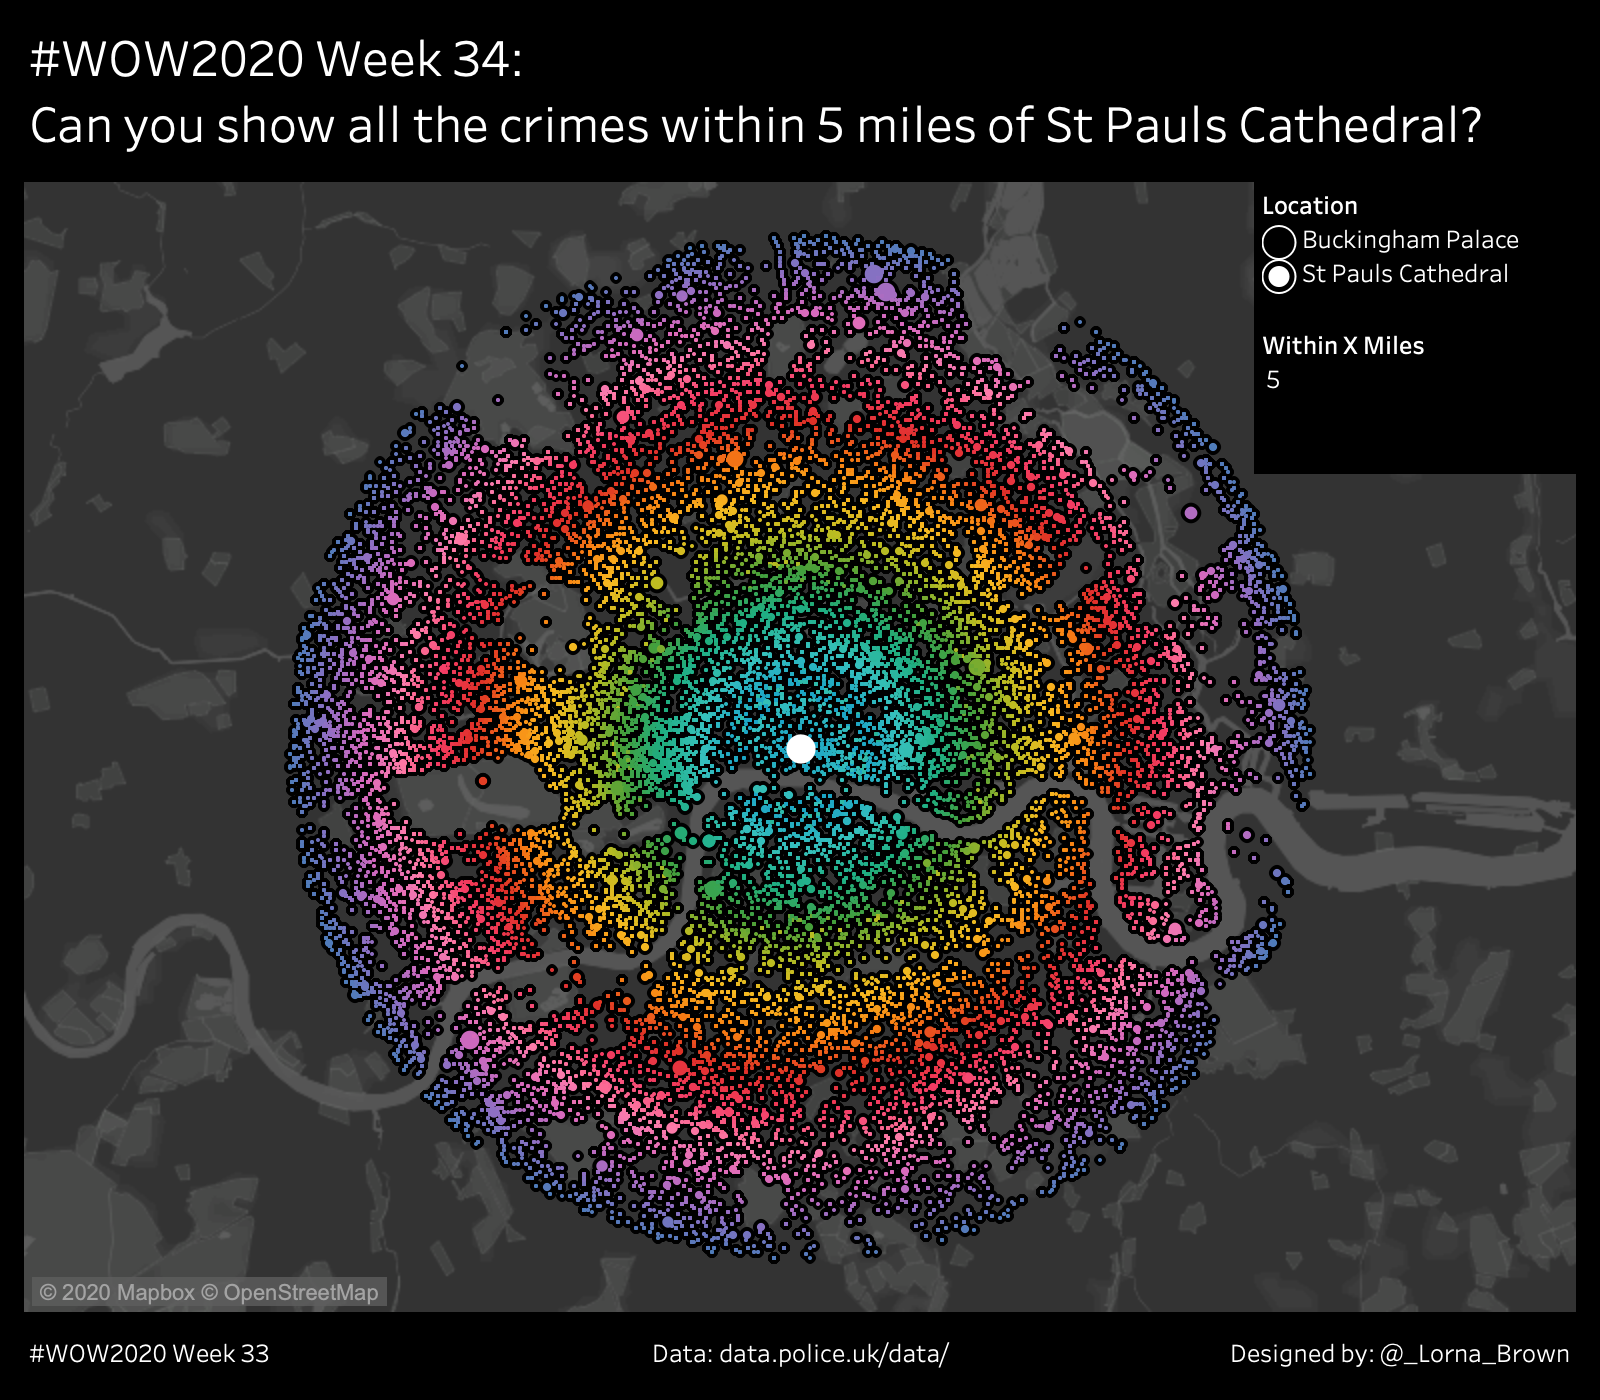
This week, I thought I would do a throwback to a speed tipping session I did in Vegas at Data19. This is using some of the cool spatial techniques. I like to think of this as a target chart, as that’s what it creates.
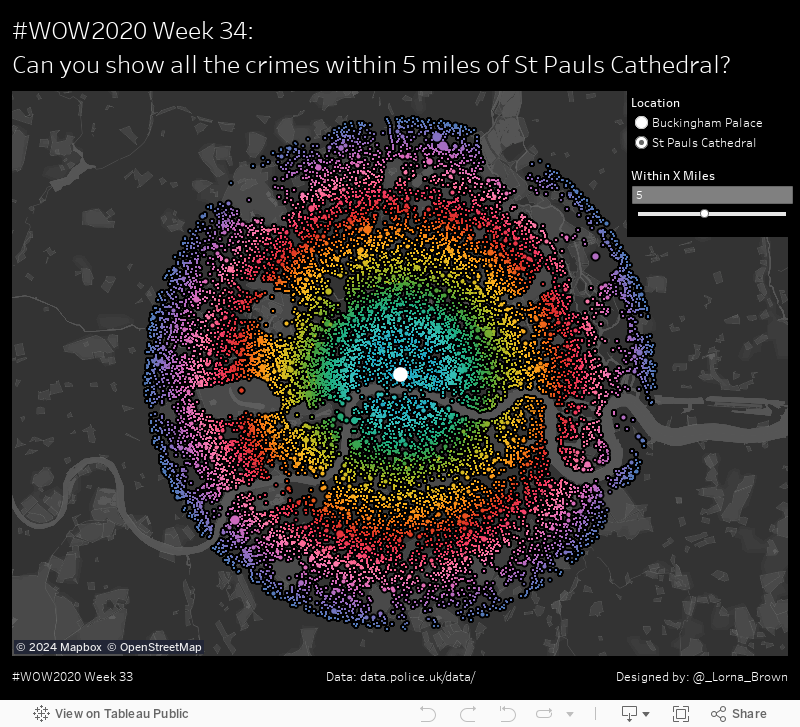
Using these two reference points create an X (1-10) mile radius to show each crime point
Buckingham Palace – 51.501364,-0.1440787
St Paul’s Cathedral – 51.5138453,-0.0983506
Have the colour blocks 10 metres apart (Set the colours at 5mile radius)
Match the Viz in Tooltips
Match formatting
Dataset
This week uses crime data from data.police.uk. I have provided you with a summary from Jan 2020 to June 2020 for crimes reported by City of London and Metropolitan Police. You can get it here at data.world
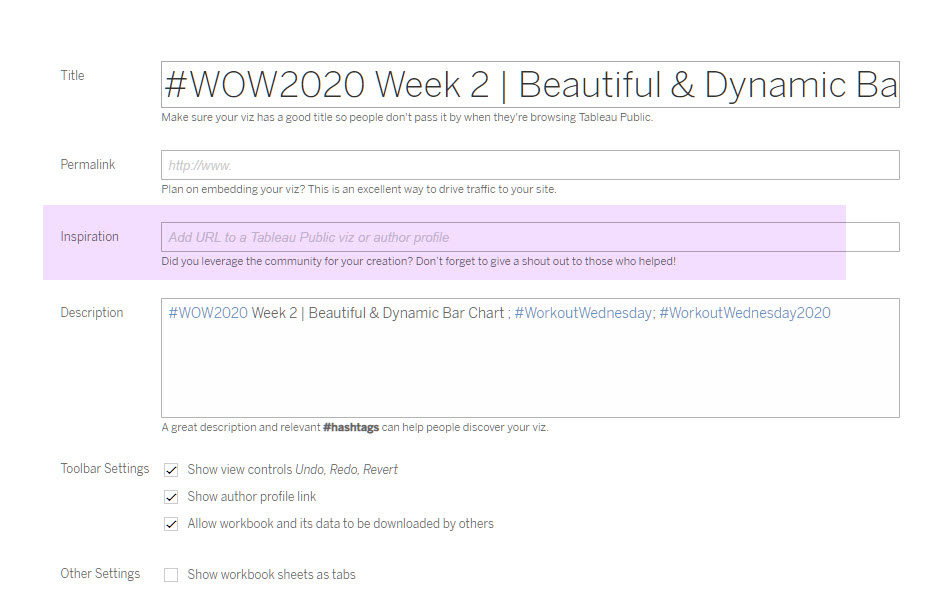
Attribute
When you publish your solution on Tableau Public make sure to take the time and include a link to the original inspiration. Also include the hashtag #WOW2020 in your description to make it searchable!