#WOW2026 | Week 18 | Let’s Visualize TC25! (#TC26 Live Edition)
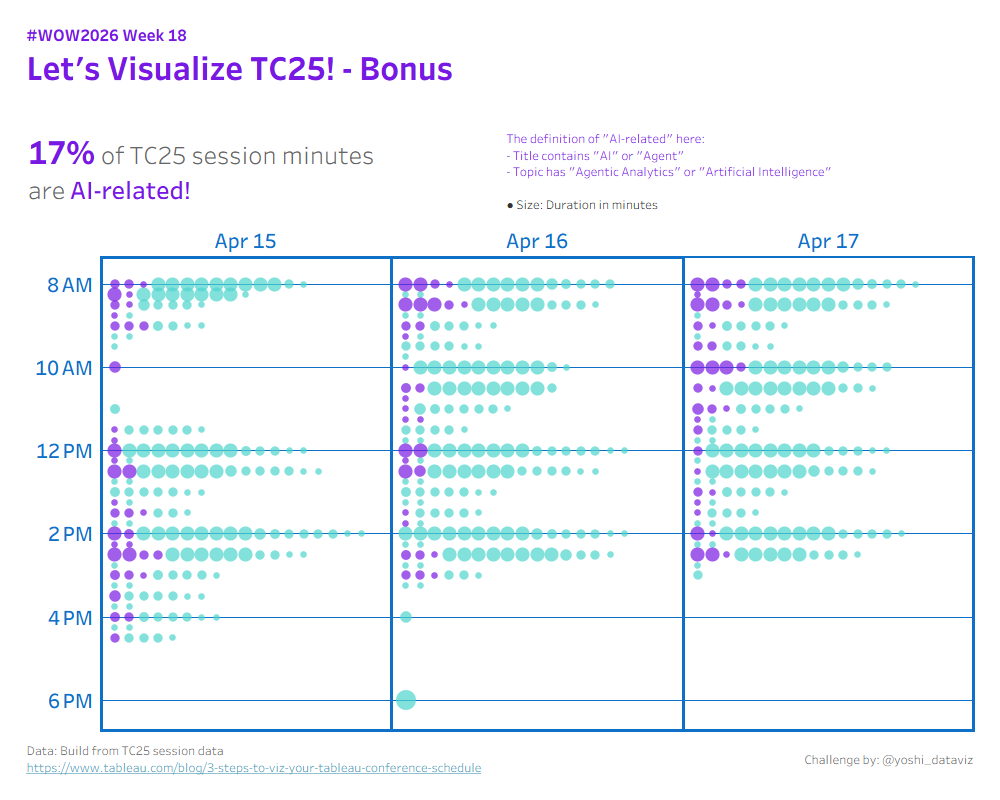
Introduction This challenge was released at the TC26 Workout Wednesday session. Whether you’re here in the room or finding it later, I hope you’ll have fun! In this challenge, we’ll visualize the sessions of Tableau Conference itself. Three difficulty tiers are available, so pick the one that matches your confidence and give it a try. […]
#WOW2026 | Week 18 | Let’s Visualize TC25! (#TC26 Live Edition) Read More »
Tableau, Workout Wednesday