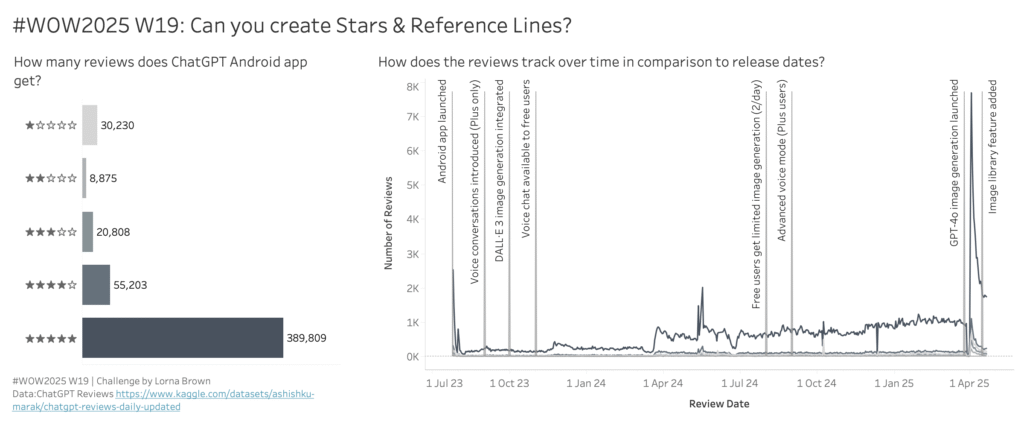
Tableau

#WOW2023 | 28 | Can you Show & Hide Legends?

Introduction This is week 28 of 2023 and week 2 of #RE-VIZ-IT and I’m bringing back my VERY FIRST #WOW challenge from WAY BACK in the summer of 2018! I chose this challenge because “back in my day” this use case required additional sheets, a “custom” chart and a lot of sheet swapping. If you …

#WOW2023 | 28 | Can you Show & Hide Legends? Read More

#WOW2023 | Week 27 | Re-viz: Discovery Dashboard

Introduction This July we bring you another month of challenges with a theme:            We are going RETRO!Each coach will be going back through the WorkoutWednesday archives and re-vizzing a challenge from the past. It may be one of their favourite challenges, or maybe there’s a much easier way to do …

#WOW2023 | Week 27 | Re-viz: Discovery Dashboard Read More

2023 Week 26: Antarctic Ice Extent

Introduction This week we are tackling Antarctic ice data. The changing sea ice will represent significant challenges for ourselves but even more for future generations. One thing we’ve come to realize in the past few years is that changes are coming much faster than we ever anticipated. For this week’s challenge we’re going to use …

2023 Week 26: Antarctic Ice Extent Read More

#WOW2023 Week 25: Can you calculate a percent difference between a range of dates?

Introduction I saw this visualisation floating around my twitter and trending on Tableau Public and thought it would make a great challenge for Workout Wednesday. Big thanks to Jacob for letting me use his visualisation as inspiration today! In this weeks workout, I want you to look at the percent change between two dates, we …

#WOW2023 Week 25: Can you calculate a percent difference between a range of dates? Read More

#WOW2023 Week 24 | Can you build a mobile KPI app?

Introduction This week’s challenge is another exploration of dynamic zone visibility, this time combined with a mobile app-like concept. Sometimes executives need just a few critical metrics at their fingertips, and this is a concept I’ve mulled around for a while (probably stemming from this concept by Anya A’Hearn) but felt like dynamic zone visibility …

#WOW2023 Week 24 | Can you build a mobile KPI app? Read More

#WOW2023 | 22 | Filtering and Highlighting

Introduction Last week, our team was faced with an unique challenge and I’m using it as the basis for this week’s challenge! The premise is quite simple – create a dashboard that shows KPIs and a trend of the selected kpi. Allow the user to filter dates, change the period type and select a period …

#WOW2023 | 22 | Filtering and Highlighting Read More

#WOW2023 | Week 21 | Profit vs Target (with Tolerance)

Introduction This week’s challenge is a slight twist on the classic Measure (bar) vs Target (gantt) chart. The key difference here is that we want to allow the user to select a ‘tolerance’ around the specific Target value. We only want to highlight months where profit was Above or Below the permited tolerance. Click to …

#WOW2023 | Week 21 | Profit vs Target (with Tolerance) Read More

2023 Week 20: Can you build a heat map with bathymetry lines?

Introduction This week, I’m introducing the idea of taking bathymetry or contour lines on maps and placing the lines on heat maps. These lines come from identifying the elevation (for contour lines) or depth of water (for bathymetry lines) and creating a map using those values. Here is an example of a contour map from …

2023 Week 20: Can you build a heat map with bathymetry lines? Read More

Scroll to Top