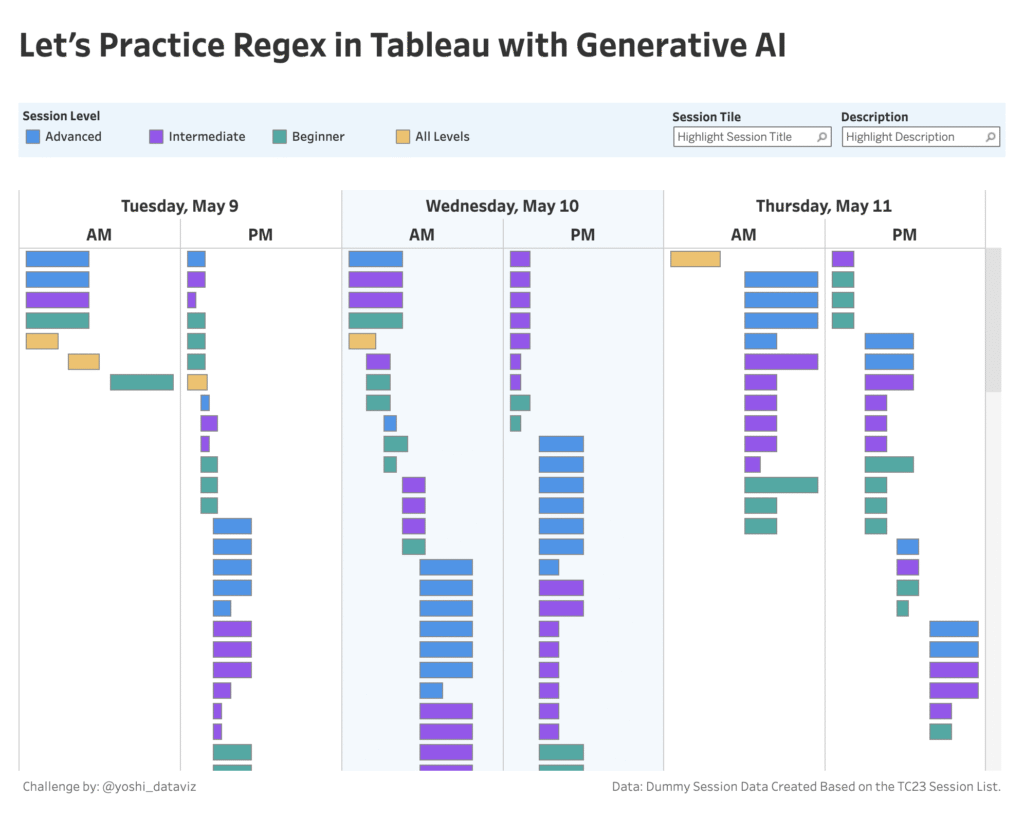
Tableau

#WOW2025 | Week 13 | Data Storytelling with Dynamic Zone Visibility

Introduction 【EN】Welcome to the second week of the Community Month! I bring a challenge inspired by Chiaki (@ishiaki_tab)! Chiaki has been a Tableau Visionaries since 2024 and a key leader in Japan TUG.Chiaki was also the winner of the Viz Games at the Salesforce World Tour Tokyo 2024, and this week’s challenge is inspired by […]

#WOW2025 | Week 13 | Data Storytelling with Dynamic Zone Visibility Read More »

#WOW2025 W12: Can you show the top X customers in EACH of the last 3 years and their contributions to Sales?

Introduction Starting the community month with a Challenge from a Data School Consultant Abby Poon. She came to me with a puzzle and we solved it together. The idea is you want to be able to see how the Top X customers are changing over the last 3 years (dynamically). Each year the top X

#WOW2025 W12: Can you show the top X customers in EACH of the last 3 years and their contributions to Sales? Read More »

#WOW2025 | Week 11 | Can you find Sales per Customer by First Purchase Cohort?

Introduction Cohort analysis is always fun to try and figure out how to show enough information without dumping every cohort onto a chart. This challenge looks at cohorts of when a first purchase was made (Superstore data), and subsequent sales to those customers. Are there certain cohorts that continually spend more money? Do certain cohorts

#WOW2025 | Week 11 | Can you find Sales per Customer by First Purchase Cohort? Read More »

#WOW2025 | Week 8 | Can you display a ratio and a volume on the same chart?

Introduction This week’s challenge is brought to you by a new guest coach, Kieran Adair. Kieran lives in Australia and has been working with Tableau for several years. He has been a long-time fan of Workout Wednesday and recently reached out to me with an idea for a challenge, which I thought you all might

#WOW2025 | Week 8 | Can you display a ratio and a volume on the same chart? Read More »

WOW2025 | Week 7 | Can you Manually Color a Highlight Table?

Introduction I’m honored to present another challenge as a WOW coach this year.Being a coach last year was a great learning experience. It made me rethink whether my approach was truly the best and if the content was genuinely valuable for WOW participants.I’m excited to continue this journey and thankful for the chance to contribute

WOW2025 | Week 7 | Can you Manually Color a Highlight Table? Read More »

#WOW2025 | Week 6 | Can You Adjust Dashboard Design by Filter?

Introduction I am truly honored to continue serving as your coach and supporting your learning this year.My first challenge in 2025 is about an exploratory dashboard. Have you ever created a dashboard that allows users to explore data step by step, from an overview to detailed information?In many cases, this can be achieved using filters

#WOW2025 | Week 6 | Can You Adjust Dashboard Design by Filter? Read More »