2025 Week 29 | Next level tooltip
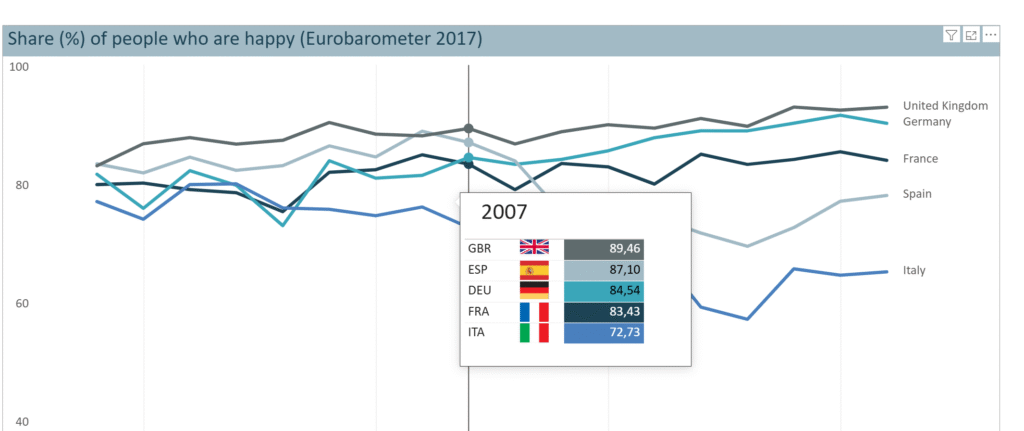
Introduction Welcome back to Workout Wednesday! This week we’re building a special tooltip.It will include flags, and some special custom formatting. Want to learn, how to create a tooltip like this?Let’s do it! Requirements Download the sample data from the Data World Website – part 1 and part 2. [Note: Data.World requires you to create a …