parameter actions

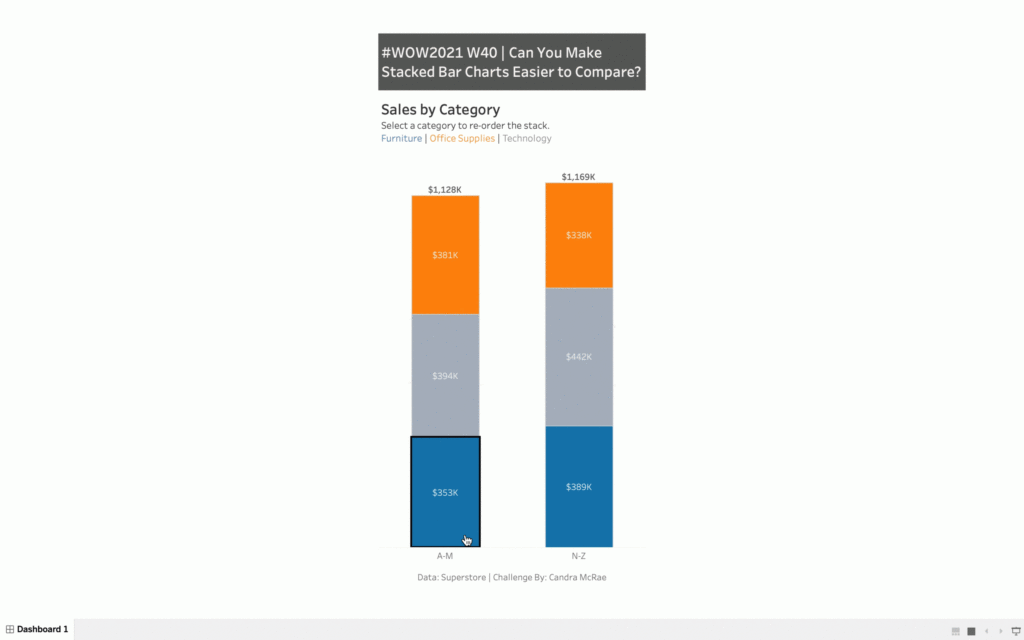
2021 W40 | Tableau: Can You Make Stacked Bar Charts Easier to Compare?

Introduction I have a confession to make…I like stacked bar charts. Someone once referred to them as rectangular pie charts, which stung a little bit – so I’ve kept my affinity quiet. Stacked bar charts get a bad rap because it can be hard to compare the different components – in fact the only one …

2021 W40 | Tableau: Can You Make Stacked Bar Charts Easier to Compare? Read More

2021 W38 | Tableau: How Can You Quickly Tell the Net Change Between Two Dates? (Community Challenge)

Introduction This week’s challenge is by Will Perkins About Will: Will has been actively involved with the external Tableau Community over the past 3 years. He has spoken at Tableau Fringe Fests, multiple TUGs, and mentored various individuals in one-off questions or more long term instances. At work, he has helped build an internal global …

2021 W38 | Tableau: How Can You Quickly Tell the Net Change Between Two Dates? (Community Challenge) Read More

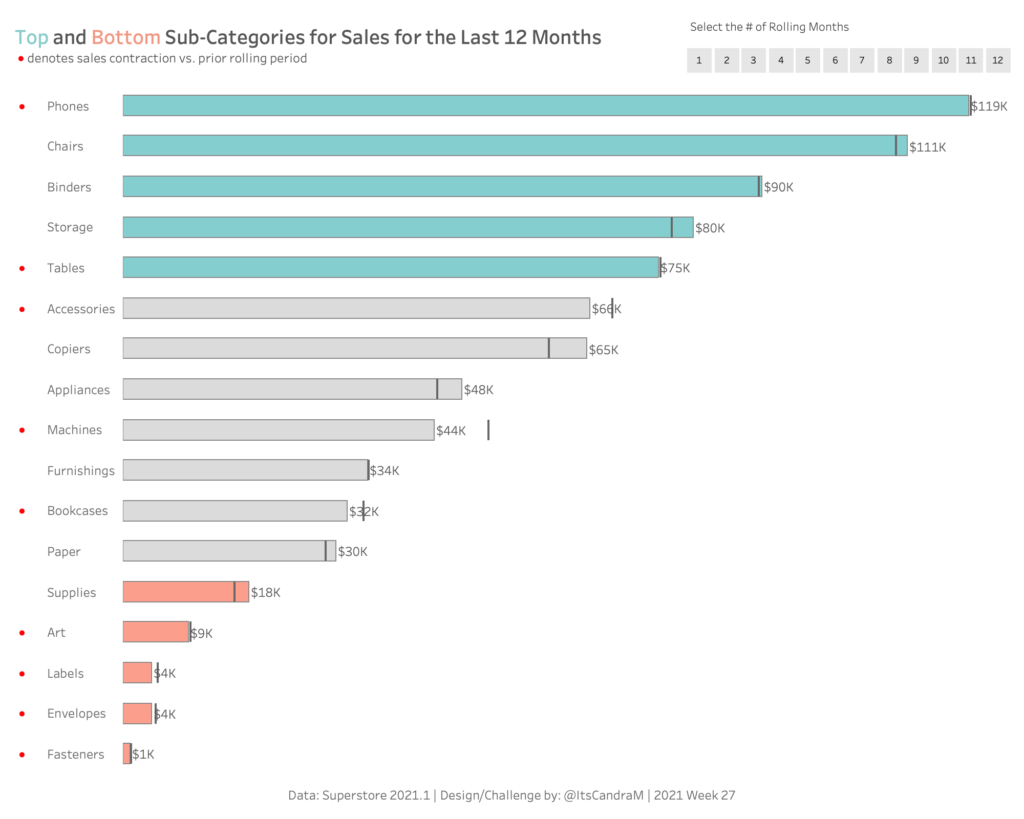
2021 Week 27: Can you find the top and bottom performers?

Introduction Like a fine pinot grigio, I really enjoy a good box-and-whisker plot. There is so much good stat stuff in one place like the min/max, median, top/bottom performers, and outliers in the data set.  I have found, however, that they are rarely used and some business end users find them hard to read.    …

2021 Week 27: Can you find the top and bottom performers? Read More

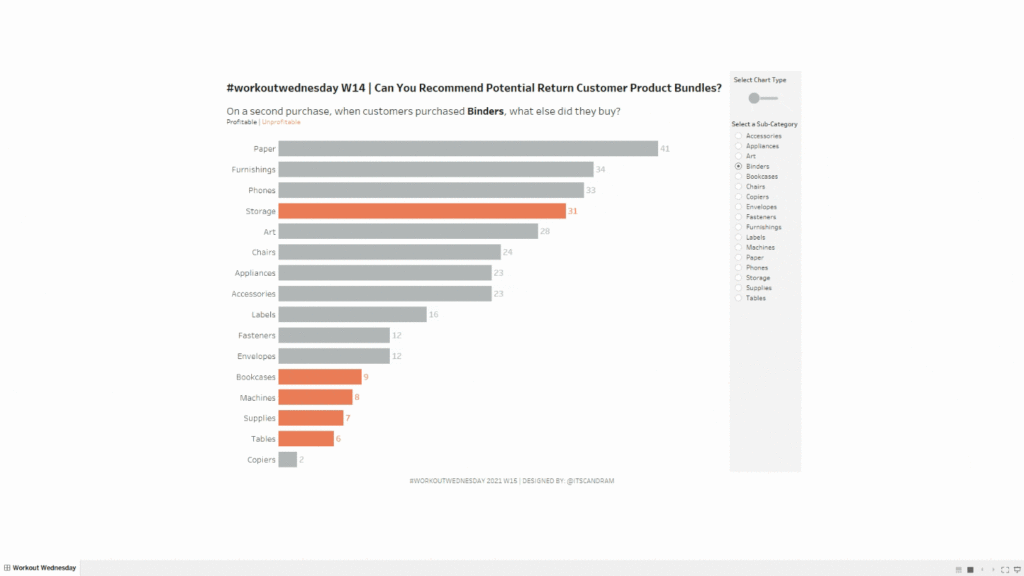
2021 Week 14 | Tableau: Can You Recommend Profitable Return Customer Bundles?

Introduction Have you ever purchased something on Amazon and they show an extra random list of products in the “Customers that purchased X also purchased…” section and you think to yourself, “How in the world did they come up with that combination (e.g., sponges and Skittles)?”  They likely have high-powered recommender engines doing all of …

2021 Week 14 | Tableau: Can You Recommend Profitable Return Customer Bundles? Read More

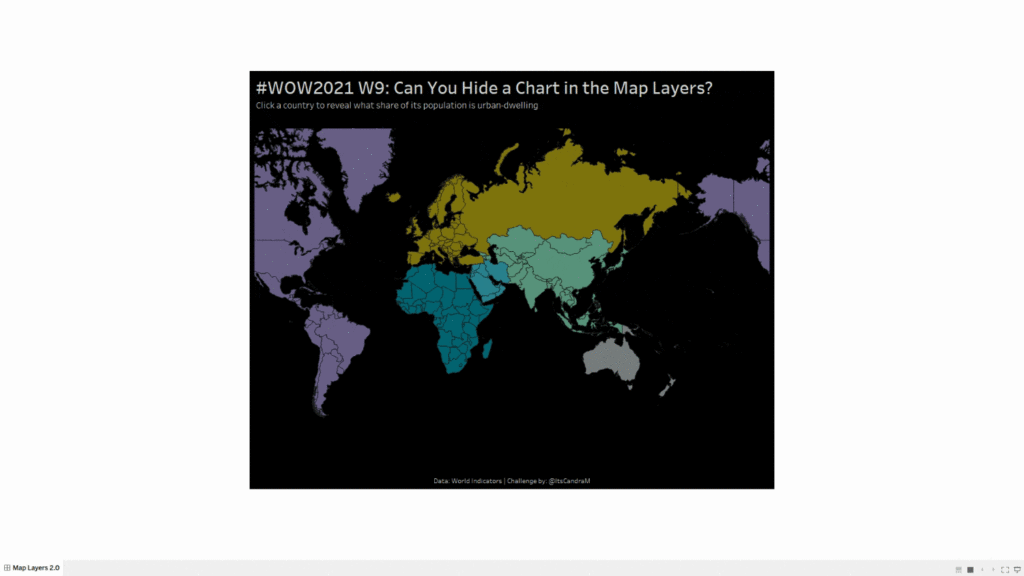
2021 Week 9: Can You Hide A Chart in the Map Layers?

Introduction So, I’m a little late for Mardi Gras – but that didn’t stop me from thinking about King Cake, a New Orleans tradition (with French roots) where a little plastic baby is put inside of a cake that is plastered with green, yellow, and purple frosting with tons of sprinkles. Anyone teeth hurt yet? …

2021 Week 9: Can You Hide A Chart in the Map Layers? Read More

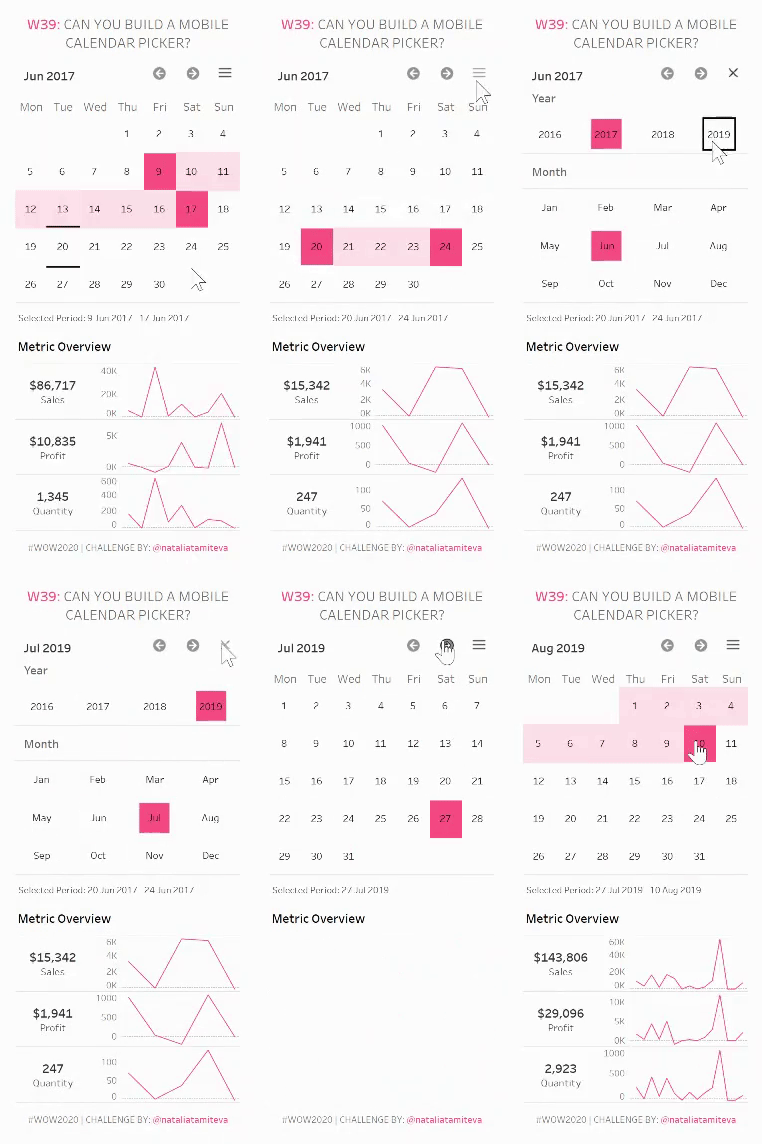
2020 Week 39: Can you build a mobile calendar picker?

Introduction Natalia Miteva is responsible for this week’s Community Workout Wednesday Challenge.  Here are all the details in Natalia’s own words: Very excited to share my challenge as part of the Workout Wednesday community contribution month! This week’s workout is inspired by Ludovic Tavernier‘s Date Range Picker viz. The aim of our challenge will be …

2020 Week 39: Can you build a mobile calendar picker? Read More

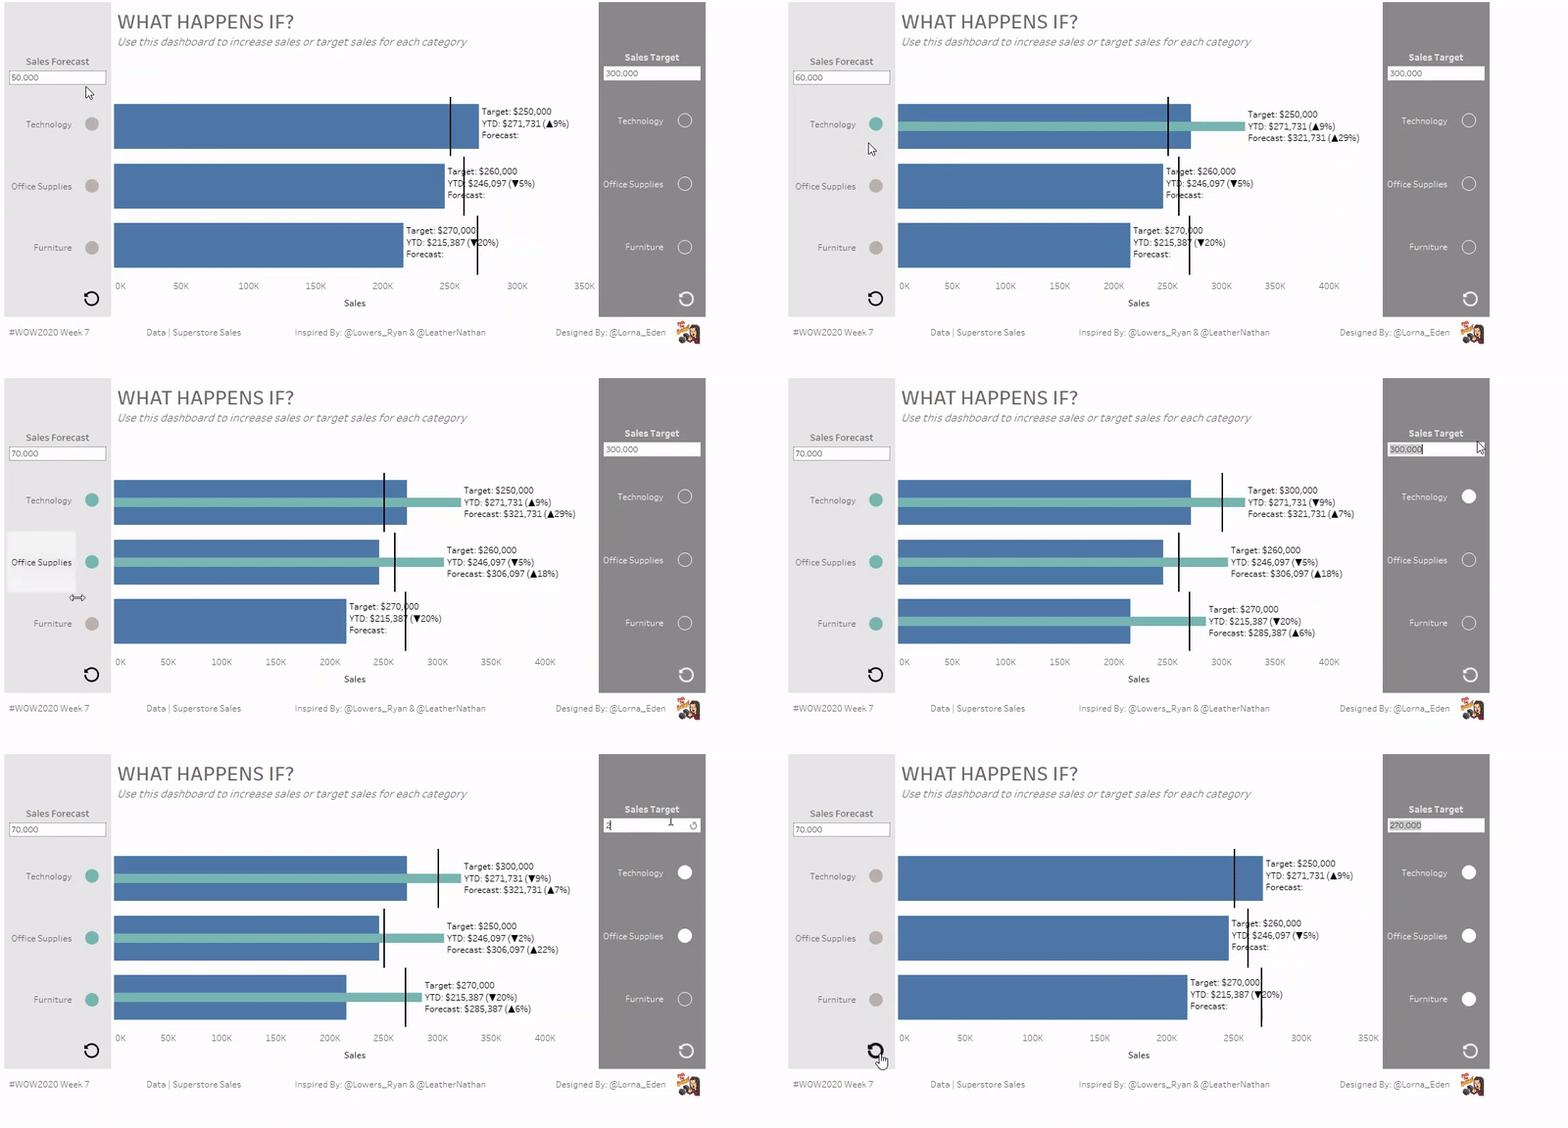
Week 7: What happens if? Can you update sales forecast and targets using only parameters?

Introduction At the last North West Tableau User Group, I watched a presentation from Ryan Lowers and Nathan Leather where they looked at using parameters as a data source. You can see their workbook here. So this week we are focusing on using Parameters as a Data Source. How can we add data to the current data we have. …

Week 7: What happens if? Can you update sales forecast and targets using only parameters? Read More

Week 42: Can you build a comparative line chart with dynamic inputs?

This week’s challenge is taken directly from a situation I recently had on a project.  The goal of the project was to be able to isolate out time periods of a specific length and compare it to the time period directly before it.  So as an example, if it’s October 2019, I want to look …

Week 42: Can you build a comparative line chart with dynamic inputs? Read More

Scroll to Top