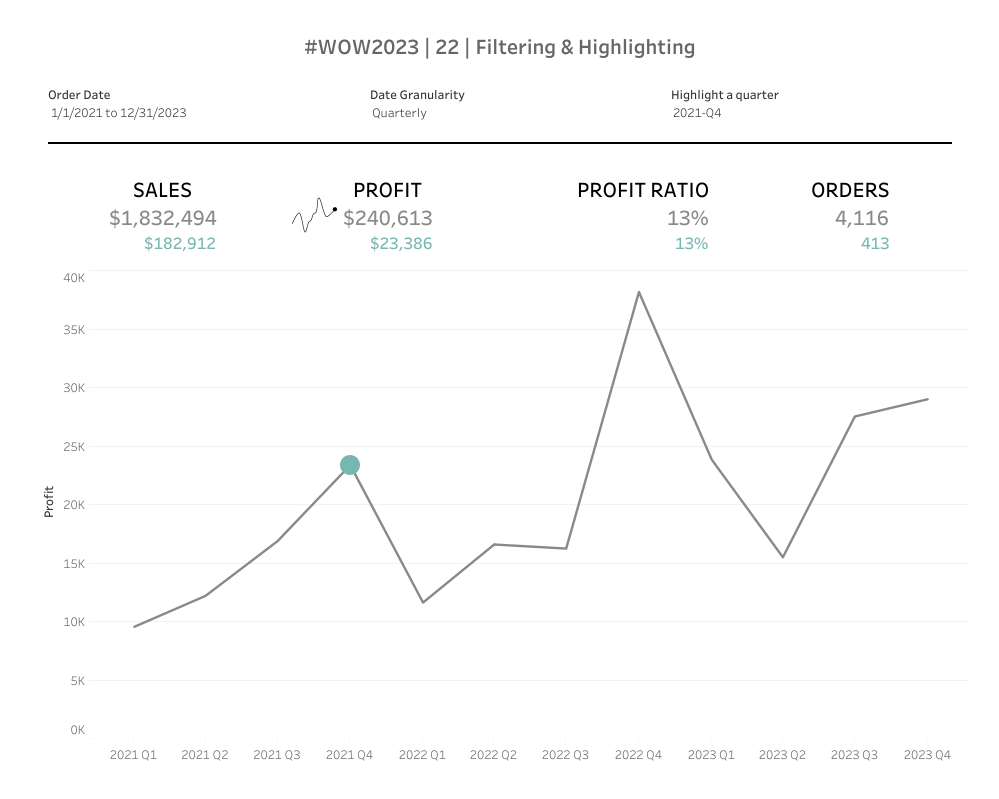
#WOW2023 | 22 | Filtering and Highlighting
Introduction Last week, our team was faced with an unique challenge and I’m using it as the basis for this week’s challenge! The premise is quite simple – create a dashboard that shows KPIs and a trend of the selected kpi. Allow the user to filter dates, change the period type and select a period …